
Methodology
1. Tracking of seabirds
Temporal and geographical scope
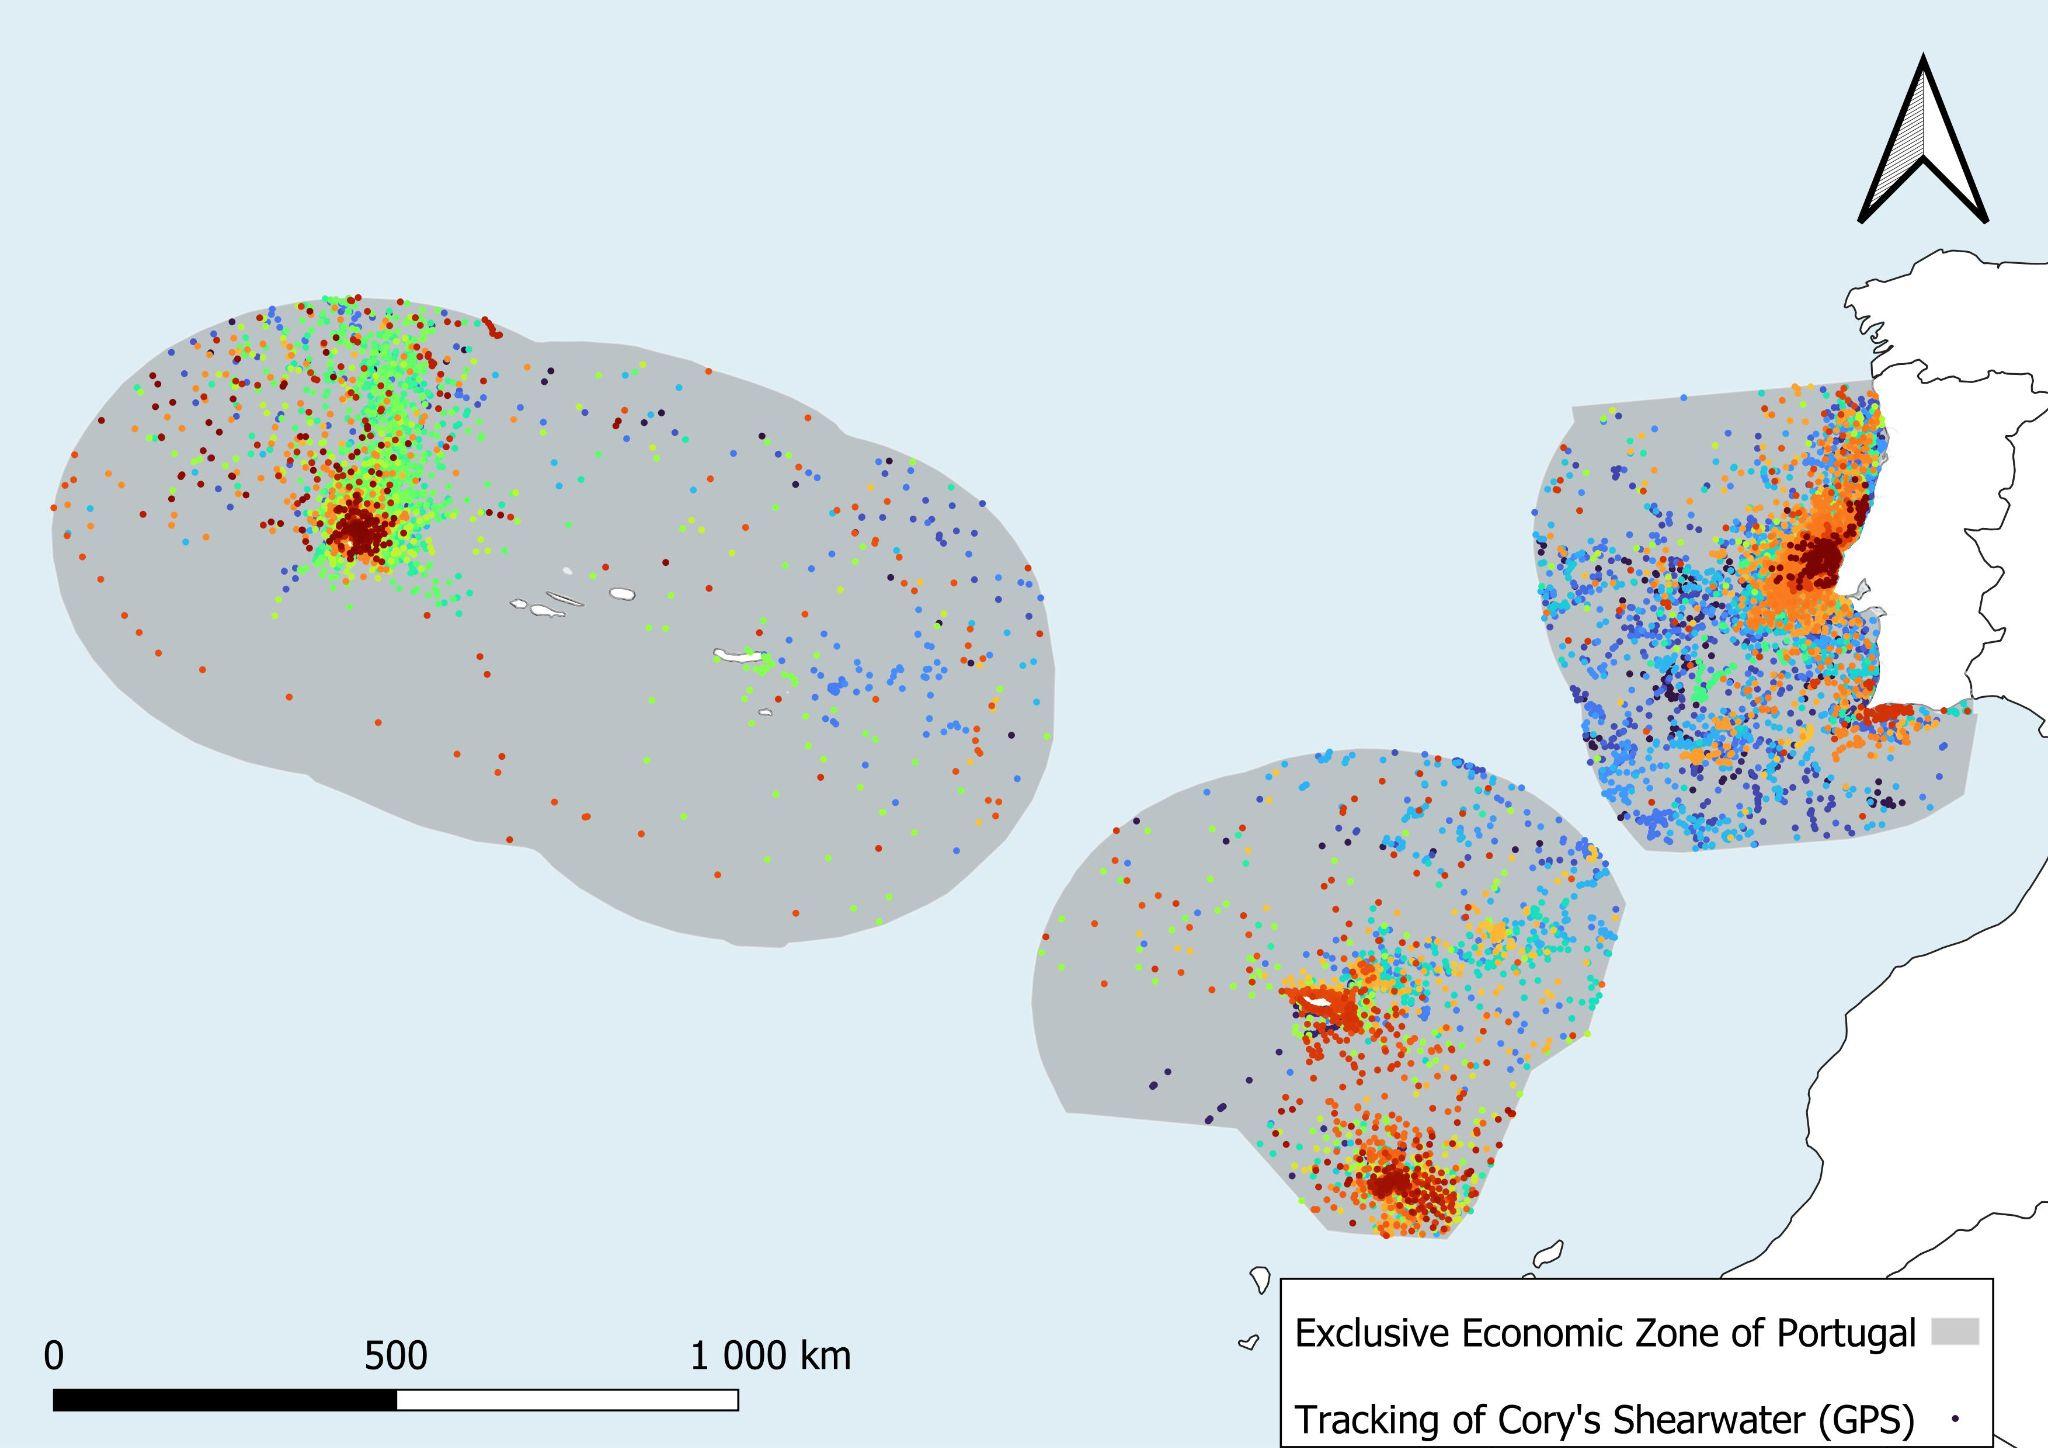
The mapping of species distribution using individual tracking data was restricted to Portugal's EEZ (see example in Figure 1). This exercise was carried out separately for each of the three sub-areas: Mainland Portugal, the Azores and Madeira. In terms of temporal coverage, all available data and those collected by individual tracking devices were included. As this is a relatively recent technology, this resulted in a time series beginning just over two decades ago. In fact, the oldest data analysed relate to the tracking of Balearic Shearwaters with satellite devices used in the year 2000. The most recent data were collected in 2025. Nevertheless, there is great heterogeneity in the coverage of the information compiled for each species, both spatially and temporally.
Data collection and preparation
The compilation of individual tracking data began with consulting three digital platforms specific to this type of information: the Seabird Tracking Database (managed by BirdLife International), Movebank (managed by the Max Planck Institute for Animal Behaviour) (Kolzsch et al. 2022) and Seatrack (owned by the Norwegian Polar Institute and the Norwegian Institute for Nature Research, NINA). These three platforms host the vast majority of individual bird tracking information available globally.
The datasets and species occurring within Portugal's EEZ were identified. The species listed in the Atlas of Seabirds of Portugal (Meirinho et al. 2014), for which little or no information was found, were subjected to a second level of research that included consulting general and specialised search engines for scientific documents. The species names (scientific and common) were used as keywords, associated with various terms, namely tracking, wintering distribution, GPS, GLS and movements. The authors of the identified works were contacted directly to request authorisation to use and access the information.
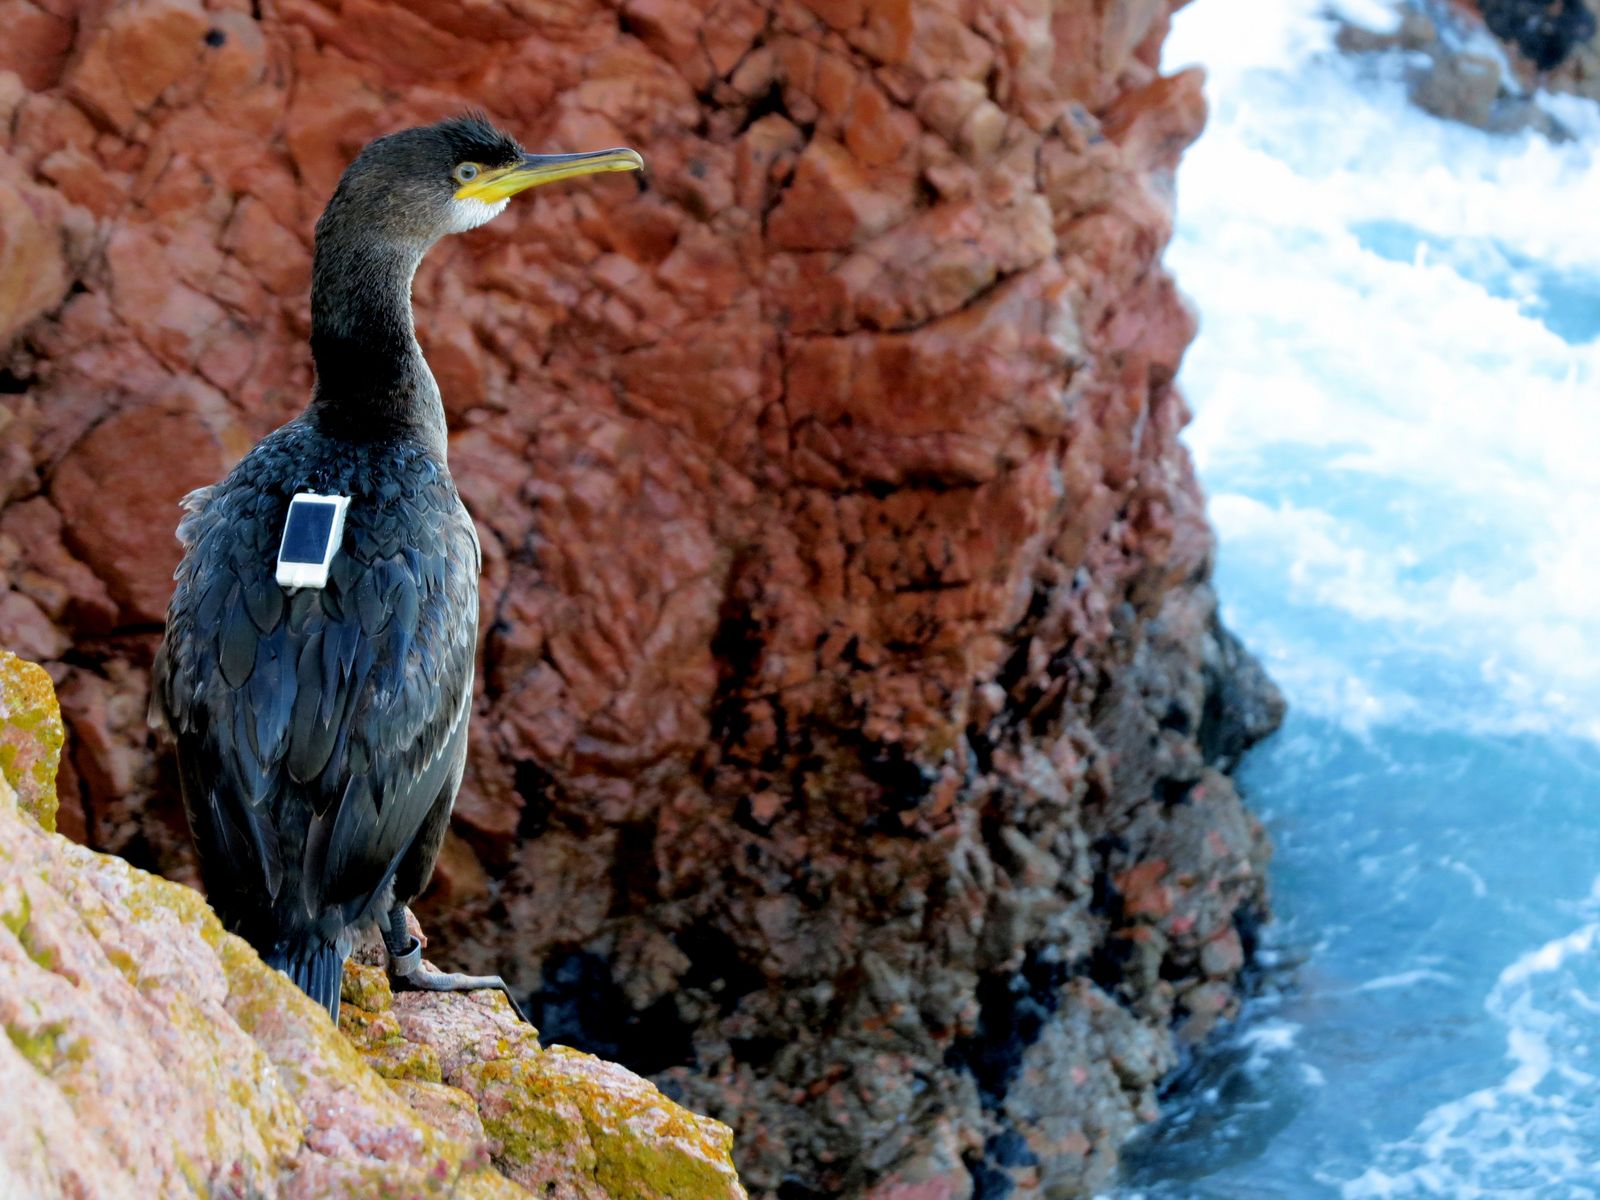
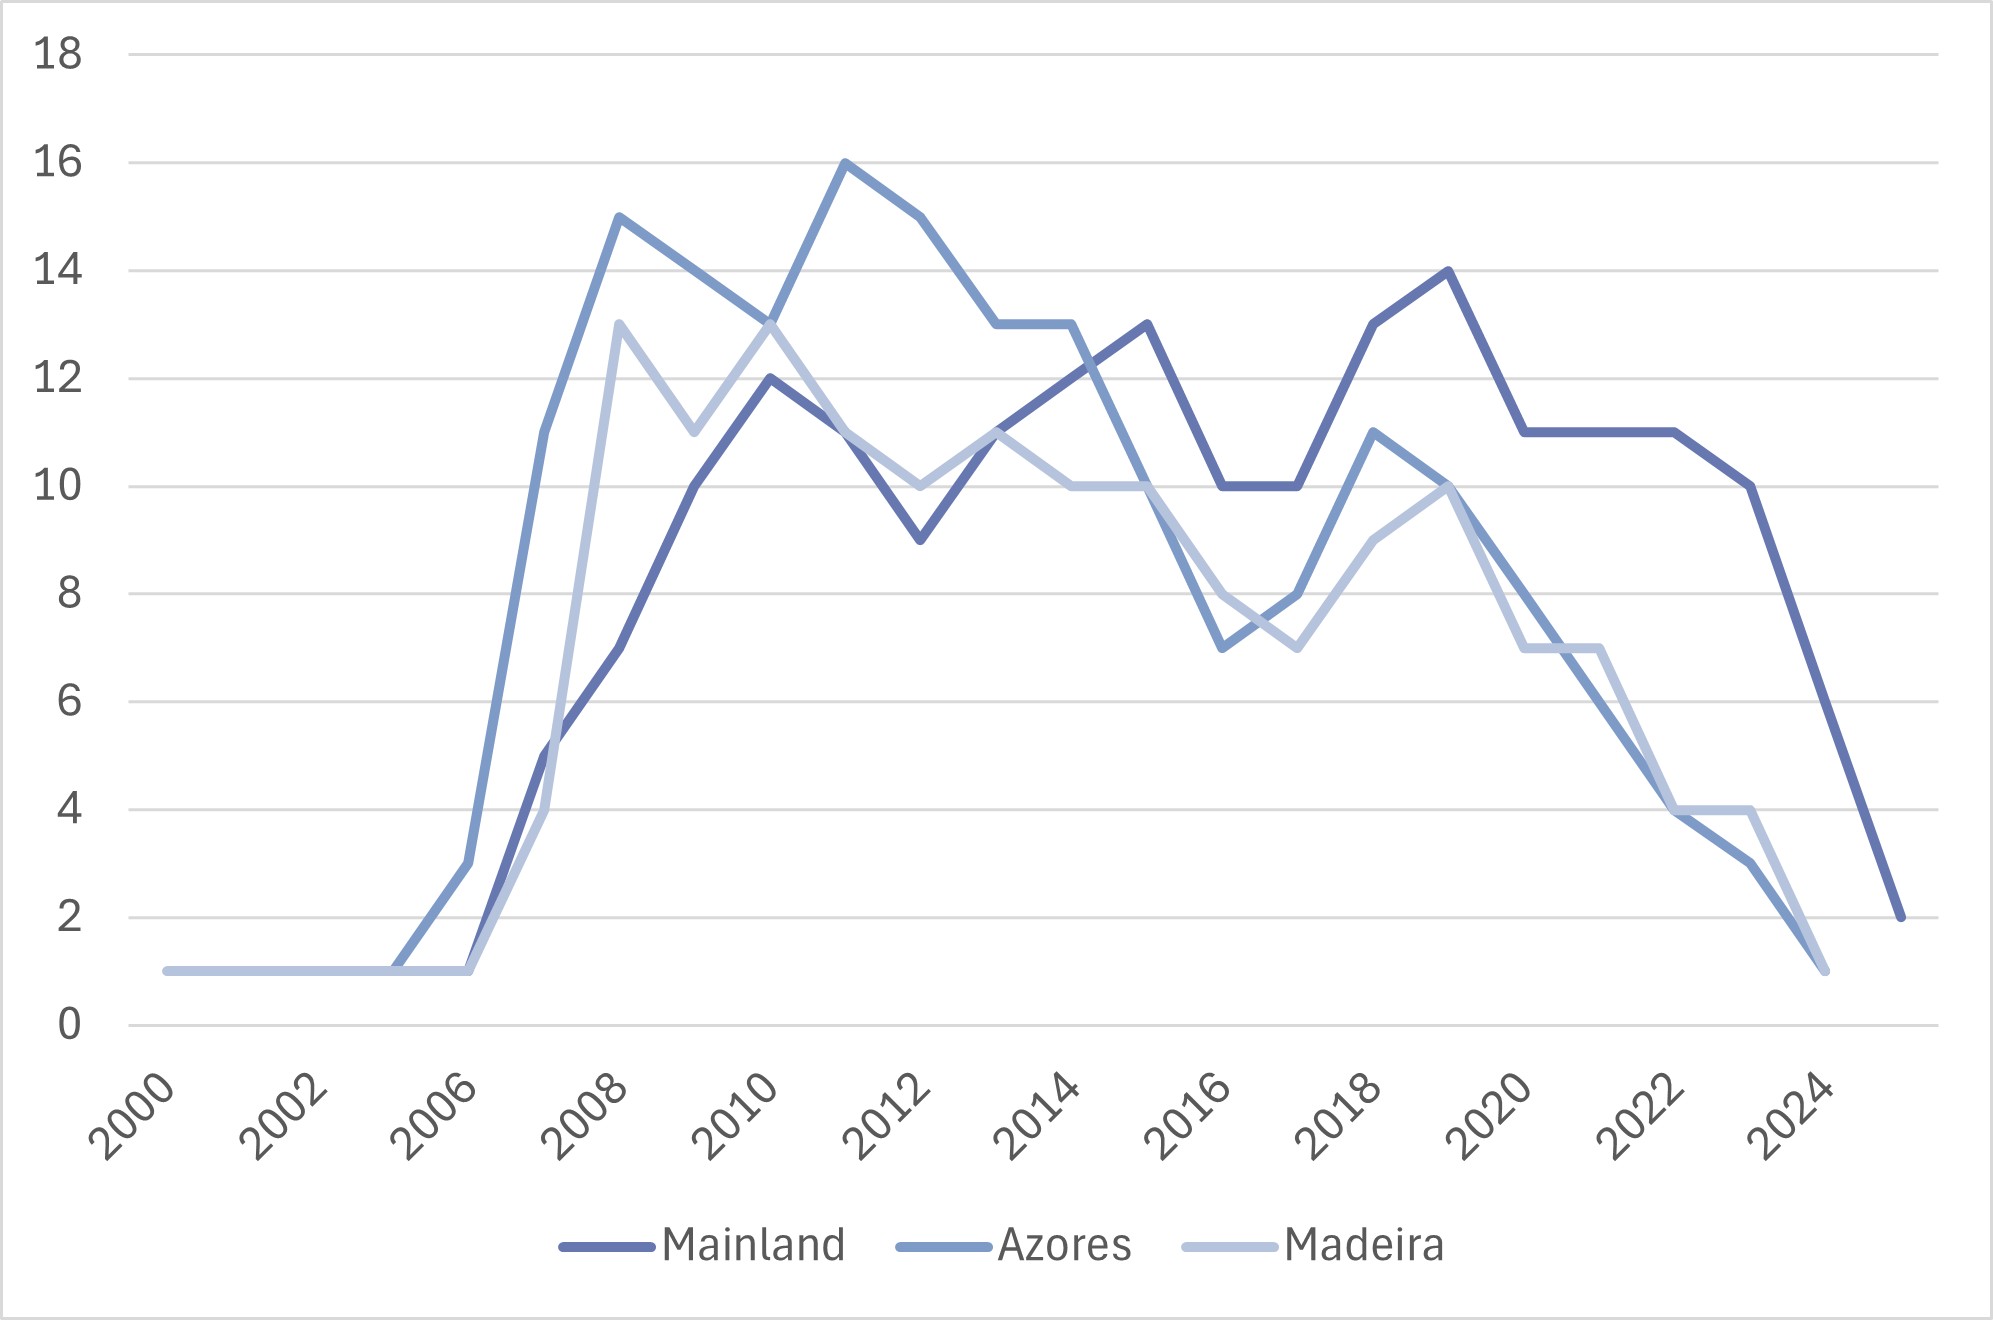
Of the 336 datasets identified as potentially overlapping with the national EEZ, 224 were made available, with the respective authorisations for use (Figure 2). Each dataset corresponded to a species nesting in a particular colony or location (with the exception of birds captured at sea), monitored with a specific type of device and during a specific period. In the case of species with data from different types of devices (i.e. GPS and GLS), GPS was prioritised due to its lower location error (only a few metres). In cases where the amount of GPS data was limited, or restricted to a small number of individuals, and GLS provided a substantially larger amount of data, the latter was preferred. This was based on the assumption that it better reflected the species' distribution, despite the higher location error (100-200 km) (Bennett et al. 2025). The data collected by GPS and PTT devices, having similar margins of error, were considered together.
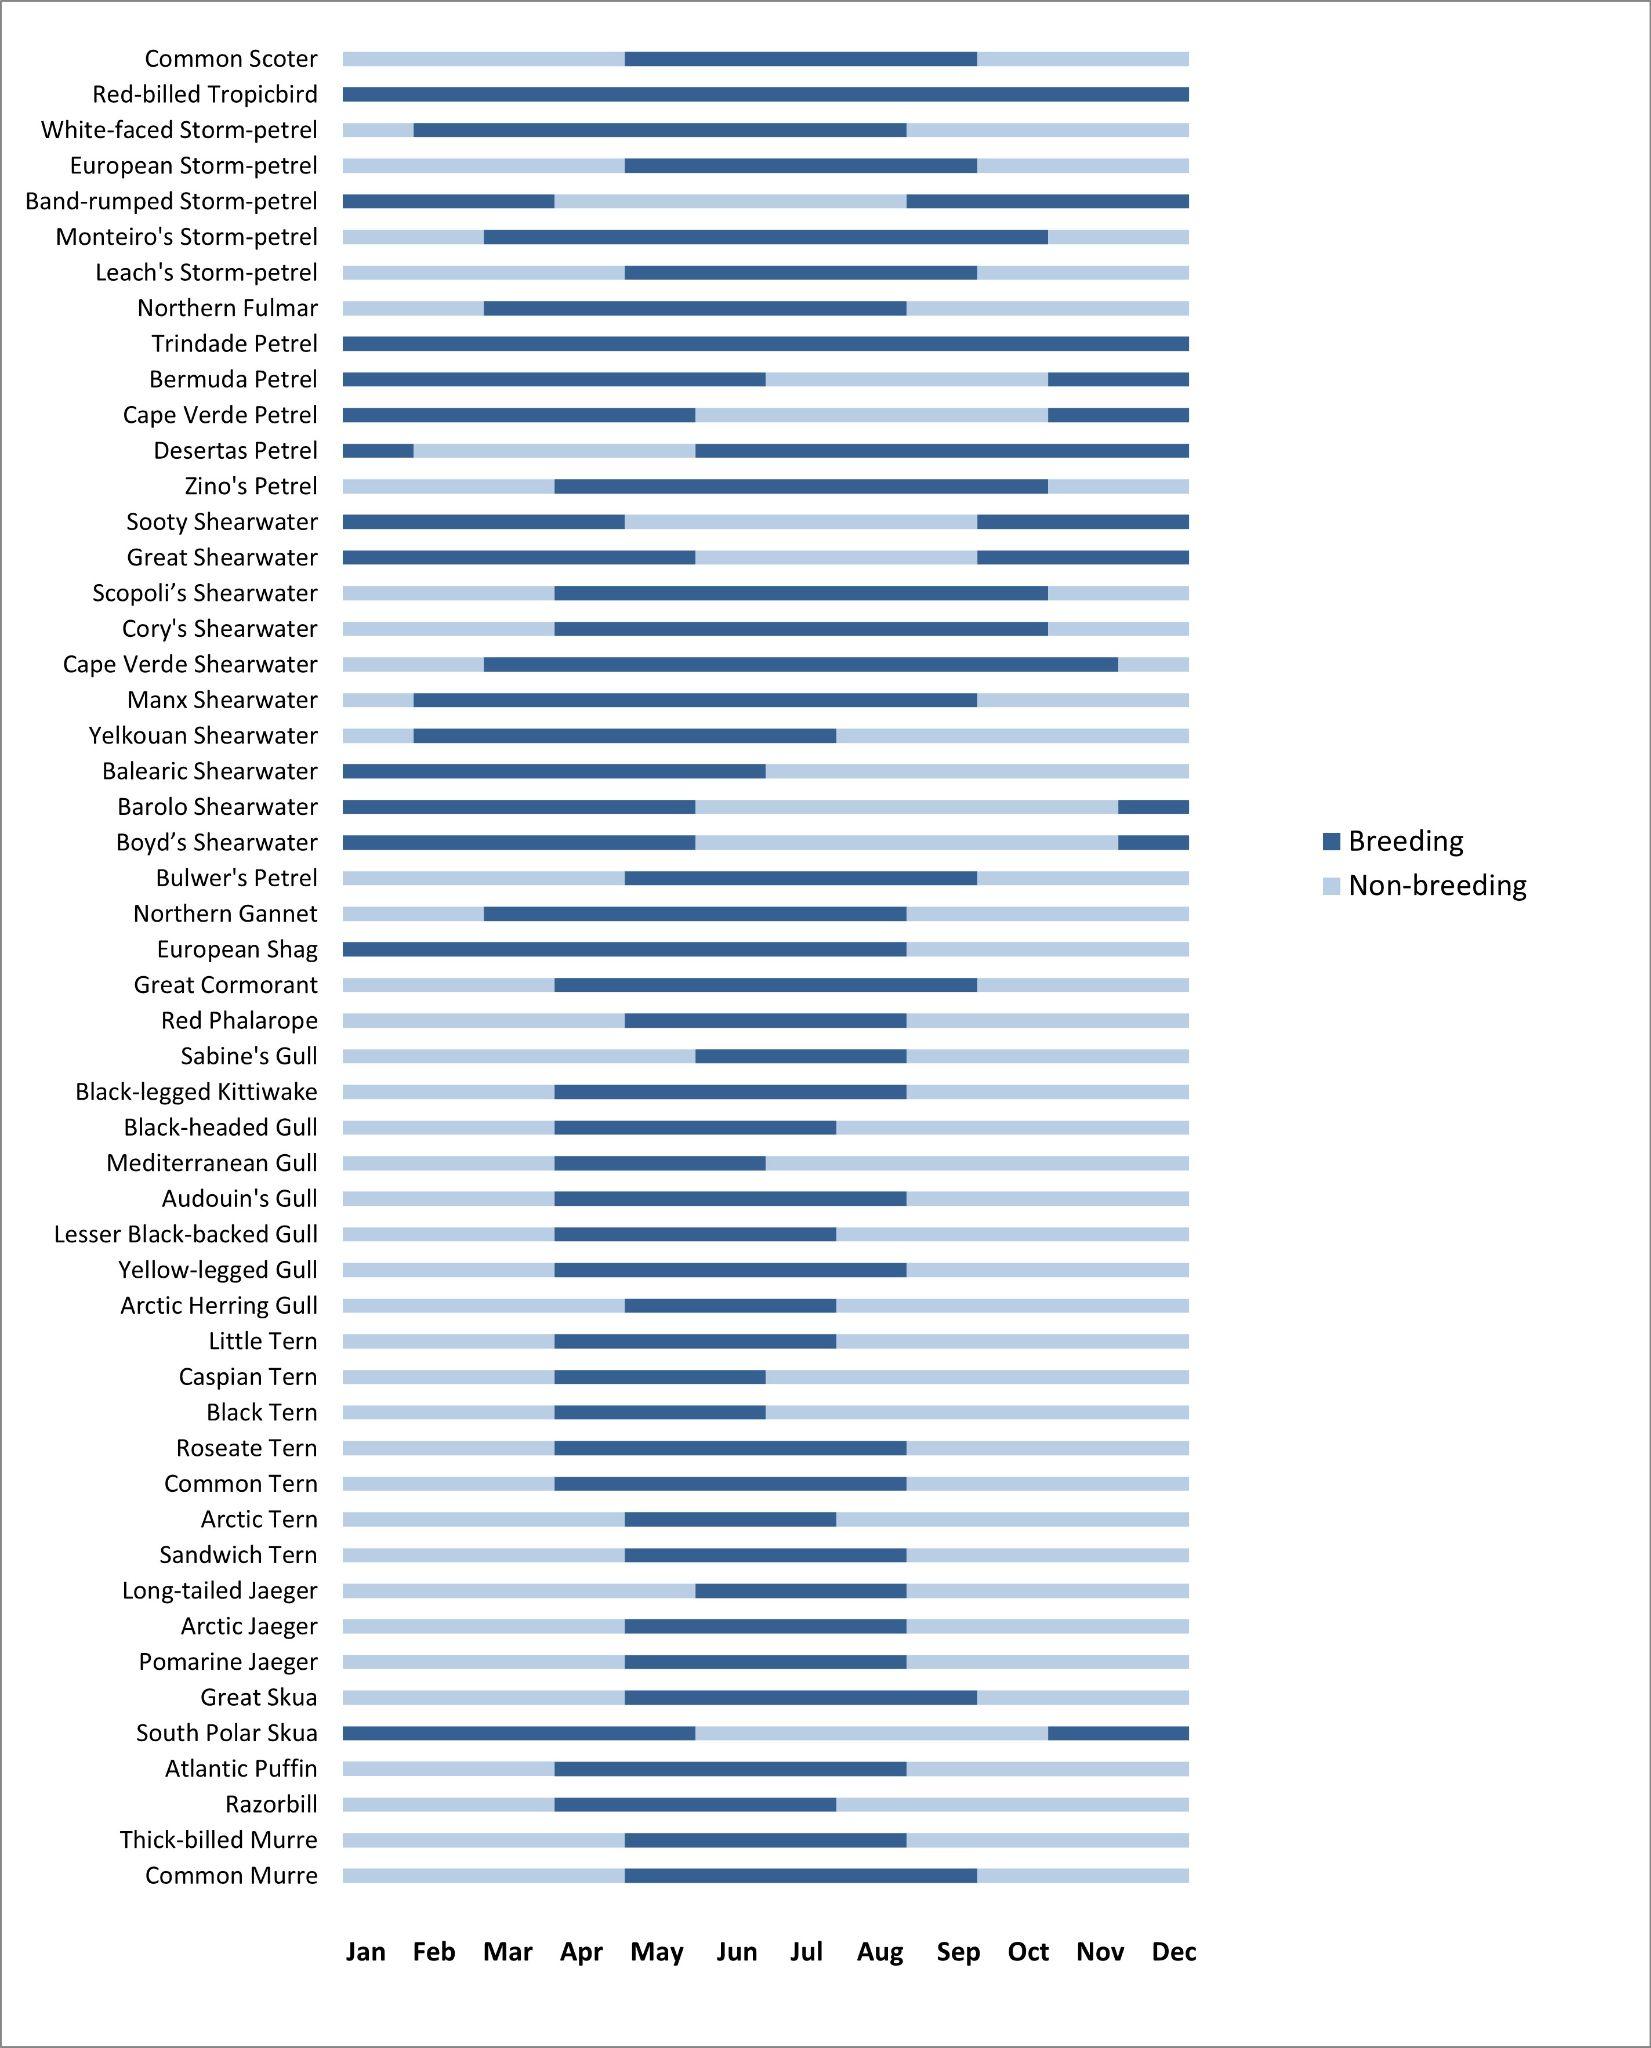
The distribution of species was mapped separately for the breeding season and the non-breeding season (Figure 3). To this end, a hexagonal grid was created to coincide with the three sub-areas of the Portuguese EEZ - Mainland, Azores and Madeira - chosen for ease of visualisation. The locations were grouped into hexagons with a diameter of 25 km for GPS data and 50 km for GLS. The sum of the number of locations within each hexagon was assigned. This processing was done using a very simple approach in order to avoid interpretations or extrapolations of the data, which would not be the purpose of this study.
2. Abundance and distribution of breeding colonies
With the aim to visually show the distribution of seabird colonies nesting in Portugal and illustrating their relative importance, this publication includes one or more maps for each of these species showing the nesting colonies on the Mainland, Madeira and the Azores. The 21 species considered (Table 4) were chosen based on the information available in the latest Atlas of Breeding Birds of Portugal (Equipa Atlas 2022).
| Species | Mainland | Azores | Madeira |
|---|---|---|---|
| White-faced Storm-petrel Pelagodroma marina | x | ||
| Band-rumped Storm-petrel Hydrobates castro | x | x | x |
| Monteiro's Storm-petrel Hydrobates monteiroi | x | ||
| Desertas Petrel Pterodroma deserta | x | ||
| Zino's Petrel Pterodroma madeira | x | ||
| Cory's Shearwater Calonectris borealis | x | x | x |
| Manx Shearwater Puffinus puffinus | x | x | |
| Barolo Shearwater Puffinus baroli | x | x | |
| Bulwer’s Petrel Bulweria bulwerii | x | x | |
| European Shag Gulosus aristotelis | x | ||
| Great Cormorant Phalacrocorax carbo | x | ||
| Black-headed Gull Larus ridibundus | x | ||
| Audouin's Gull Larus audouinii | x | ||
| Lesser Black-backed Gull Larus fuscus | x | ||
| Yellow-legged Gull Larus michahellis | x | x | x |
| Sooty Tern Onychoprion fuscatus | x | ||
| Little Tern Sternula albifrons | x | ||
| Common Gull-billed Tern Gelochelidon nilotica | x | ||
| Whiskered Tern Chlidonias hybrida | x | ||
| Roseate Tern Sterna dougallii | x | x | |
| Common Tern Sterna hirundo | x | x | x |
| Common Murre Uria aalge | * |
*Note: Although the Common Murre is still considered a nesting species, its breeding has not been observed since 2002.
The challenge of mapping and quantifying seabird colonies is exacerbated by the lack of information that still persists about some populations, mainly due to the difficulty of surveying inaccessible locations, but also to the nocturnal and elusive behaviour of many of them. Another significant difficulty is the absence of long-term monitoring programmes in many locations and for many species.
Temporal and geographical scope
Initially, the aim was to limit the use of information to the most recent data, considering only the last five years (2021-2025). Nevertheless, due to existing information gaps for many species and locations, the temporal coverage was extended for some populations in order to include the best available information. In the case of species whose nesting sites and abundance patterns show high variability, such as terns, due to their behavioural flexibility and the greater exposure of their habitats to human pressures, data from the last 10 years (2016-2025) were included.
In terms of location, the identification of nesting sites on the Mainland included island environments, such as the Berlengas and the Barrier islands, but also the coastal strip, namely cliffs and coastal wetlands, including estuaries and lagoons. Nesting sites in inland reservoirs, such as Alqueva, were also included. Nesting colonies in the archipelagos of Madeira and the Azores were also identified, with the aim of illustrating the colonies in the three regions (Mainland, Azores and Madeira) separately for better visualisation and interpretation of the results.
Data collection
Information on nesting colonies was collected in the following ways:
- Request for data from researchers and government institutions
Requests for data were made to researchers who are conducting or have conducted monitoring work on seabird colonies, regarding the location and size of breeding colonies. The same type of request for information was sent to government entities, both on the Mainland (Instituto da Conservação da Natureza e das Florestas, ICNF) and in the archipelagos (Instituto das Florestas e Conservação da Natureza, IFCN, and Secretaria Regional do Ambiente e Ação Climática, SRAAC). To facilitate information sharing and standardisation of the data collected, a file template for data sharing was sent in Excel format (Table 5). - Bibliographic collection
Reference publications, scientific articles, and technical project reports were consulted to gather information on colony locations and population sizes. - Additional data sources
For some species (e.g., Great Cormorant), additional information was also collected from other types of platforms, such as eBird/PortugalAves, on the location of nesting colonies. Additional data were only considered in duly proven cases, i.e., when there was documentary evidence of breeding (e.g., photographic record), and it was possible to determine the corresponding location.
| Parameter | Description |
|---|---|
| Species | Scientific name of the species |
| Region | Mainland, Madeira Autonomous Region or Azores Autonomous Region |
| Island | Name of the island |
| Islet/Colony | Name of the islet or colony |
| Colony coordinates | Latitude and longitude, in decimal format |
| Coastal strip coordinates | Where the monitored area corresponds to an extensive coastal strip, the start and end coordinates of that coastal strip should preferably be indicated or, alternatively, the central coordinates of that coastal strip. |
| Coordinate accuracy | High: 0 - 50 m Medium: 50 - 250 m Low: >250 m |
| Population estimate | Count or estimate of population size |
| Interval | Minimum and maximum value of the population estimate |
| Counting unit | Number of pairs, nests or individuals |
| Estimation accuracy | A - Estimated margin of error less than 10% B - Estimated margin of error less than 50% C - Estimated margin of error greater than 50% D - Unknown |
| Census method | 1 - Surveying/counting nests/pairs 2 - Listening |
| Census coverage | Complete – Most of the potential area has been monitored Incomplete – A significant part of the potential area has not been monitored (>25%) Very incomplete – A significant part of the potential area has not been monitored (>50%) |
| Year | Year or range of years of population count or estimate |
| Reference | The source and authorship of the data must be indicated, stating whether they are unpublished data or citing a report, book or article, if these data have already been published. |
| Notes | Further information |
Data preparation
The data were organised into individual files, with information on coordinates, population estimates and date of estimate, by species and by region (Mainland, Azores Autonomous Region, and Madeira Autonomous Region). In the case of nearby colonies (<1 km), the information was aggregated in order to optimise the visualisation of the maps. The estimates were also organised by abundance classes in order to facilitate the visualisation and interpretation of the data on the maps and to minimise the impact of less accurate estimates. Where there were several population estimates, the criterion for selection was to use the most recent ones, except in cases where the previous estimates were more complete and/or accurate, in which case these were given priority.
In cases where the species occurs in more than one region, an additional file was prepared with information on the various regions and the aggregate population estimate per island or group of islands (e.g., Desertas, Selvagens). In these cases, the location shown is not the location of the colony, but a central location on the island or the largest island, in the case of a group of islands.
The list of data used and their sources can be found in the Book version.
3. Population Status Assessment
The assessment of the indicators in this publication was carried out separately for each species and region (Mainland, Azores and Madeira). For species with breeding and non-breeding or migratory populations, the assessment focused only on the breeding population (except in the case of the Lesser Black-backed Gull Larus fuscus and the Great Cormorant Phalacrocorax carbo).
Temporal and geographical scope
The information used to assess the environmental status of nesting seabirds included historical series available in the literature and existing databases, reflecting the most up-to-date information available until 2024. In spatial terms, the assessment was separated by region - Mainland, Azores and Madeira. In the case of the assessment of non-breeding seabird populations, information collected between 2004 and 2024 through marine censuses on board vessels was considered. This assessment was carried out only for Mainland Portugal, restricted to the coastal zone up to a depth of 200 m, due to the absence of a robust time series that would allow this exercise to be conducted for the Azores and Madeira regions. In the case of the assessment of non-breeding wader populations, the information was collected in winter (December and January) between 2009 and 2025, as part of the Project Arenaria. The coverage of this project included the non-estuarine coast of Mainland Portugal and the entire coast of the Azores and Madeira islands.
Indicator B1 – Marine Bird Abundance (breeding populations)
The assessment of this indicator followed the methodology described by Dierschke et al. (2022b) and adopted by OSPAR (OSPAR Agreement 2016-09). This assessment is based on the construction of time series of annual estimates of the relative abundance of breeding birds. As not all colonies and breeding sites were sampled in every year of the time series, missing values were interpolated from sampled years using generalised additive models (GAM) (Ward et al. 2014). Only colonies or breeding sites with more than two years of observed abundance data were included in this analysis.
In this indicator, relative abundance is presented as the number of adult birds or the number of breeding pairs observed or estimated annually in proportion to a reference value, using the following equation.
Relative abundance = annual abundance / reference value
The reference value for abundance was established based on the available information, giving priority to the historical reference value (abundance value prior to the start of the time series). In the absence of such a value, it was decided to use the initial period of the time series, i.e. the first 10 years. In this case, the reference value was obtained through predictions based on a generalised linear model to seek an annual trend in that period. The p-values and confidence intervals of the estimates were calculated assuming a ‘Quasi-Poisson’ distribution in order to take into account the overdispersion of the data. If this regression was significant for the first 10 years (p-value ≤ 0.05), the value estimated by the model for the first year was used as the base value; otherwise, the average abundance for the first 10 years was used, excluding years without counts. The geometric mean abundance over the last six years of the time series (i.e. the most recent period) was evaluated in comparison with the reference value. In the case of species that have recently colonised (<50 years) any of the regions, namely the Lesser Black-backed Gull Larus fuscus and Audouin's Gull Larus audouinii, the average of the five most recent years of the time series was used.
| Species | Abundance | Productivity | ||||
|---|---|---|---|---|---|---|
| Mainland | Azores | Madeira | Mainland | Azores | Madeira | |
| Band-rumped Storm-petrel Hydrobates castro | x | x | x | x | ||
| Monteiro's Storm-petrel Hydrobates monteiroi | x | x | ||||
| Desertas Petrel Pterodroma deserta | x | x | ||||
| Zino's Petrel Pterodroma madeira | x | x | ||||
| Cory's Shearwater Calonectris borealis | x | x | x | x | x | x |
| Barolo Shearwater Puffinus baroli | x | |||||
| Bulwer's Petrel Bulweria bulwerii | x | x | ||||
| European Shag Gulosus aristotelis | x | x | ||||
| Great Cormorant Phalacrocorax carbo | x | |||||
| Audouin's Gull Larus audouinii | x | |||||
| Lesser Black-backed Gull Larus fuscus | x | |||||
| Yellow-legged Gull Larus michahellis | x | x | x | |||
| Little Tern Sternula albifrons | x | |||||
| Common Gull-billed Tern Gelochelidon nilotica | x | |||||
| Roseate Tern Sterna dougallii | x | |||||
| Common Tern Sterna hirundo | x | |||||
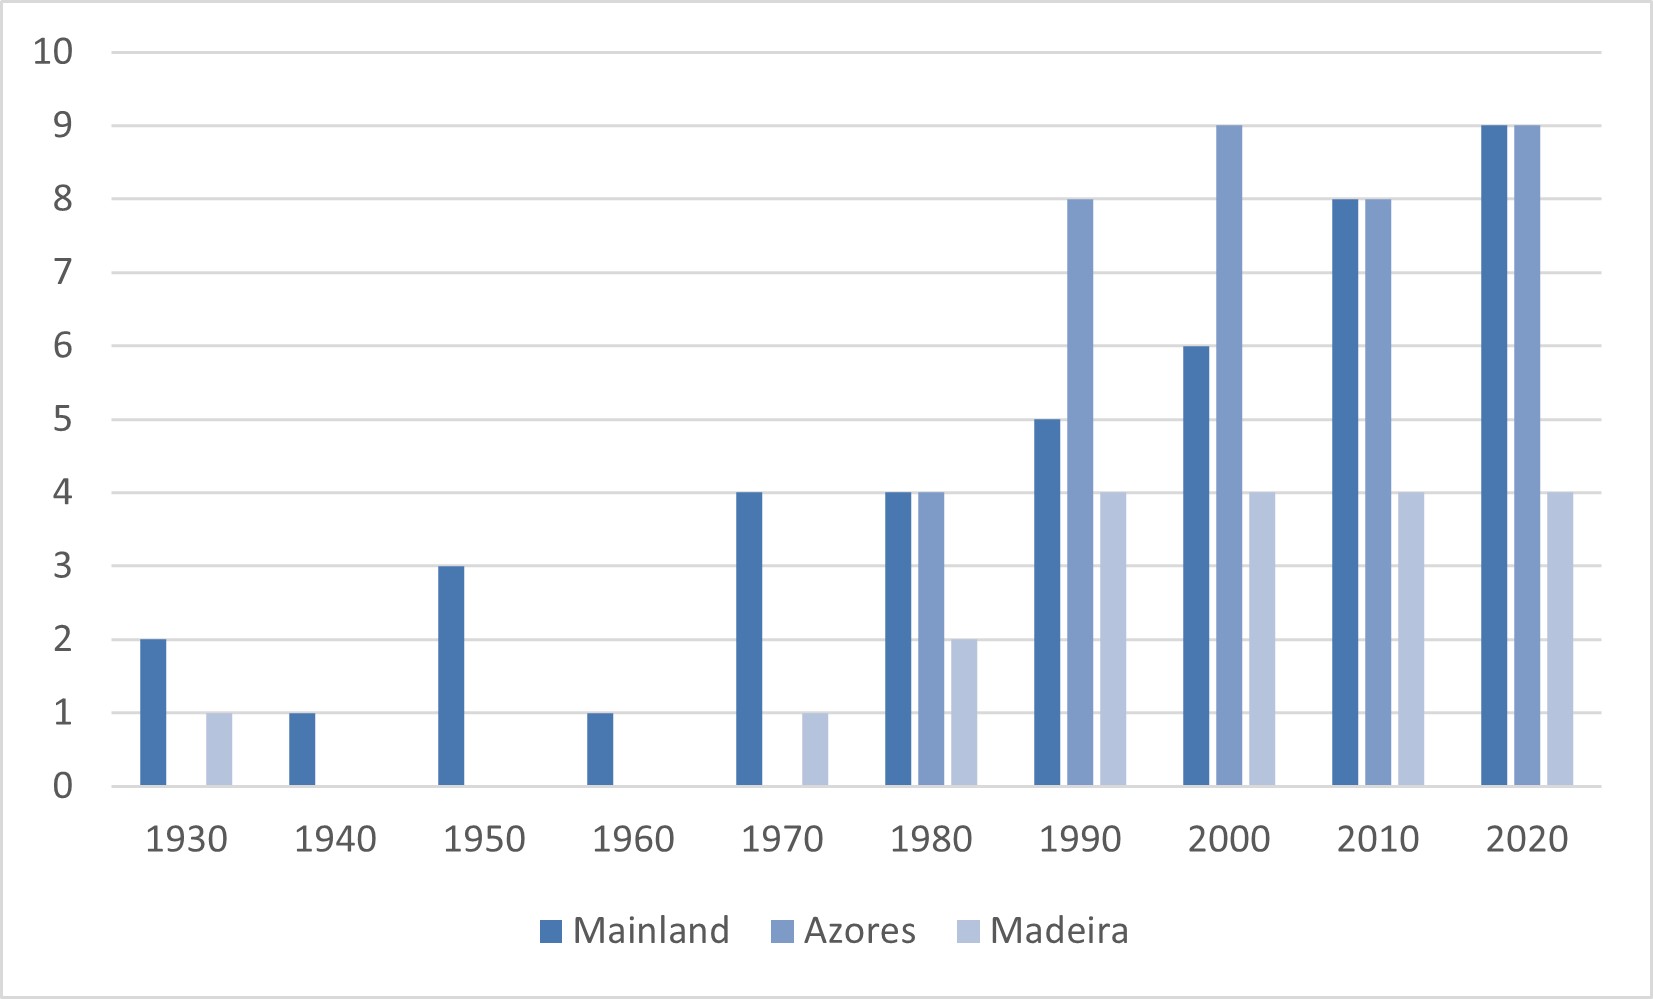
The assessment values for the relative abundance trend indicator are defined based on the magnitude of change relative to the reference value, pre-established at 1. The threshold for the annual relative abundance of a species to achieve good environmental status of the population was set at a proportion of 0.7 (or 70%) of the reference value for species that lay more than one egg, or 0.8 (or 80%) for species that lay a single egg. The most recent value in the time series was used to assess the current environmental status of the population in each region. It was possible to make this assessment for a group of 16 different species (Table 6; Figure 4).
Indicador B1 – Abundance of non-breeding seabirds and waders
The assessment of this indicator followed the methodology described by Dierschke et al. (2022a), adopted by OSPAR (OSPAR 2016-09). This indicator was constructed from time series of the relative abundance of seabirds and waders at sea or along the coastal fringe, respectively, during the non-breeding period.
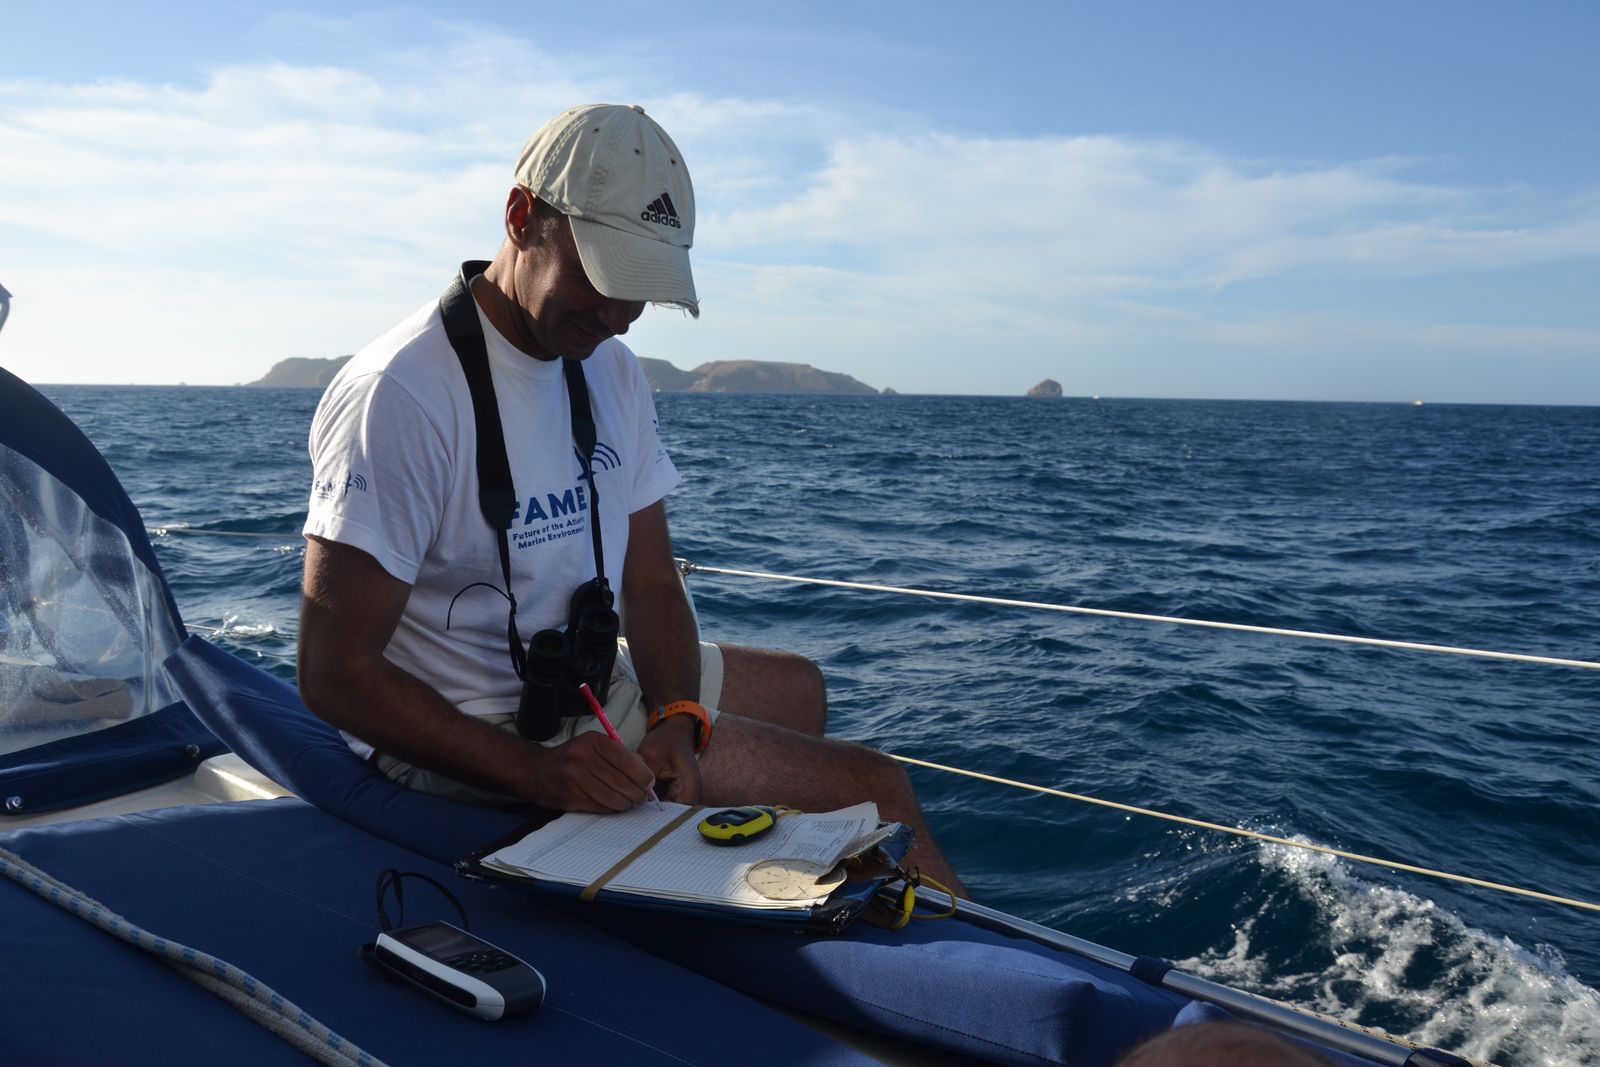
Information about seabirds (except for Common Scoter Melanitta nigra, Great Cormorant and Black-headed Gull Larus ridibundus) was obtained through censuses conducted on board vessels. Data were collected in a standardised manner, following the European Seabirds At Sea (ESAS) (Camphuysen & Garthe 2004) methodology. The estimate of the number of birds occurring annually in the region was obtained through trend analysis, based on species distribution generalised additive models (sdGAM) with an appropriate autocorrelation structure (Mercker et al. 2021).
| Species | Mainland | Azores | Madeira |
|---|---|---|---|
| Seabirds | |||
| Common Scoter Melanitta nigra | x | ||
| European Storm-petrel Hydrobates pelagicus | x | ||
| Sooty Shearwater Ardenna grisea | x | ||
| Great Shearwater Ardenna gravis | x | ||
| Manx Shearwater Puffinus puffinus | x | ||
| Balearic Shearwater Puffinus mauretanicus | x | ||
| Northern Gannet Morus bassanus | x | ||
| Great Cormorant Phalacrocorax carbo | x | ||
| Black-legged Kittiwake Rissa tridactyla | x | ||
| Black-headed Gull Larus ridibundus | x | x | x |
| Mediterranean Gull Larus melanocephalus | x | ||
| Lesser Black-backed Gull Larus fuscus | x | ||
| Black Tern Chlidonias niger | x | ||
| Sandwich Tern Thalasseus sandvicensis | x | ||
| Arctic Jaeger Stercorarius parasiticus | x | ||
| Pomarine Jaeger Stercorarius pomarinus | x | ||
| Great Skua Catharacta skua | x | ||
| Atlantic Puffin Fratercula arctica | x | ||
| Razorbill Alca torda | x | ||
| Waders | |||
| Eurasian Oystercatcher Haematopus ostralegus | x | x | |
| Grey Plover Pluvialis squatarola | x | x | x |
| Common Ringed Plover Charadrius hiaticula | x | x | x |
| Kentish Plover Charadrius alexandrinus | x | x | x |
| Whimbrel Numenius phaeopus | x | x | x |
| Ruddy Turnstone Arenaria interpres | x | x | x |
| Red Knot Calidris canutus | x | x | |
| Sanderling Calidris alba | x | x | x |
| Dunlin Calidris alpina | x | x | x |
| Purple Sandpiper Calidris maritima | x | x | |
| Common Sandpiper Actitis hypoleucos | x | x | x |
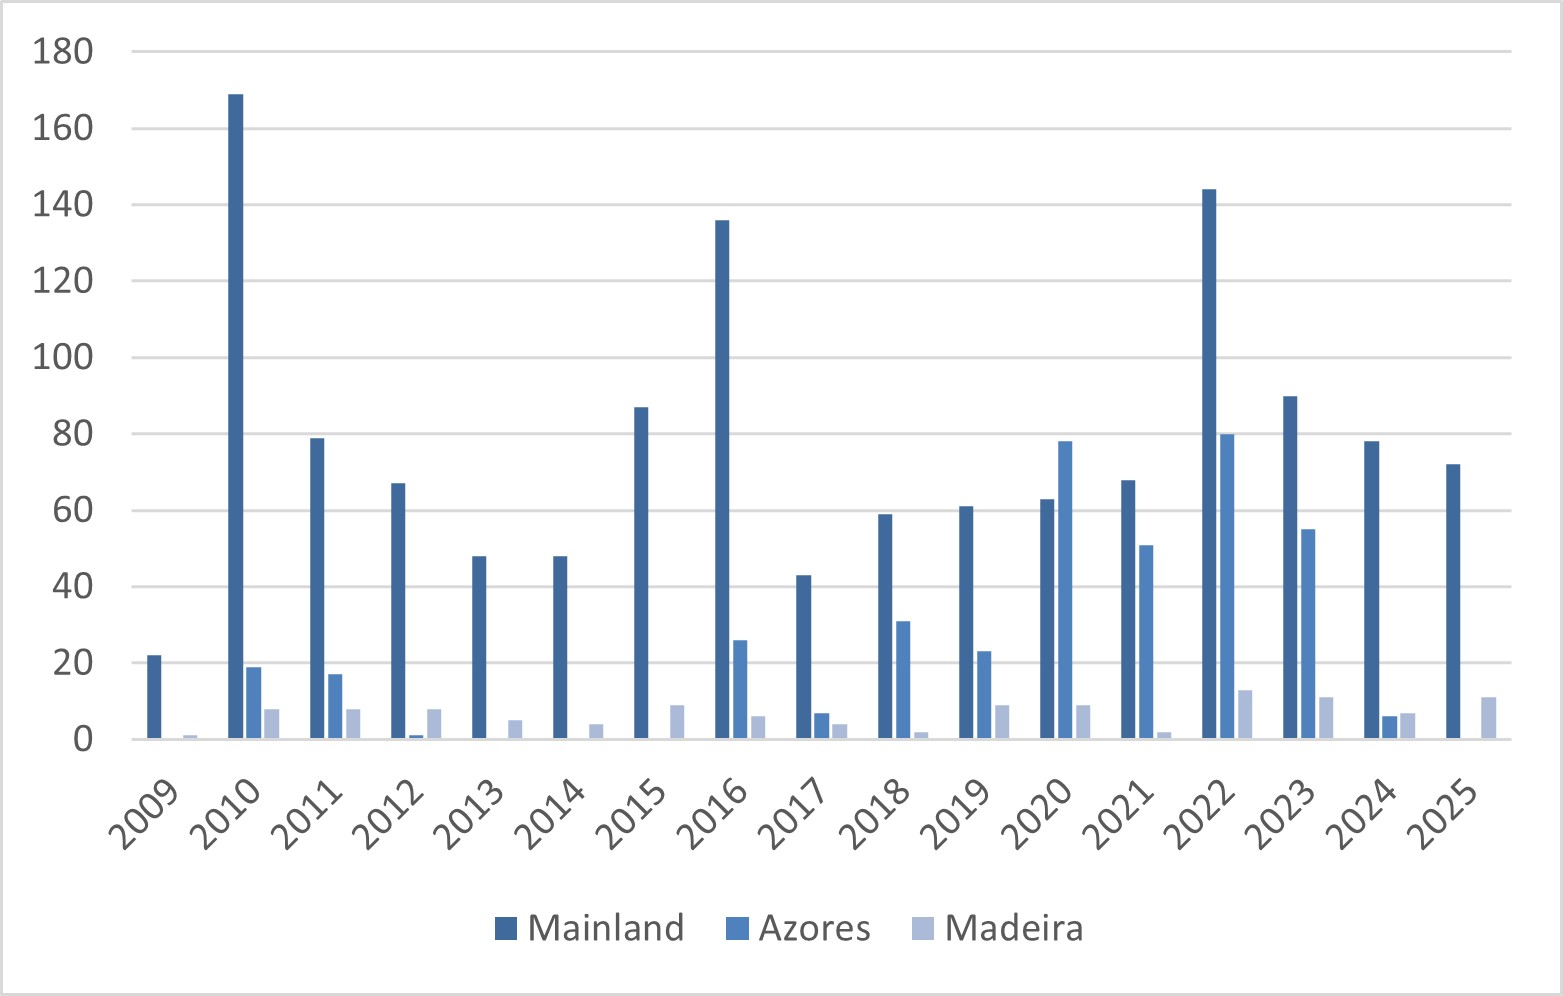
In the case of waders, Great Cormorants and Black-headed Gulls, data collection was carried out within the framework of the Project Arenaria, following the methodology described by Lecoq et al. (2013). Counts were added up for each grid square in each year (Figure 5), resulting in the estimated number of birds. For the Common Scoter, annual estimates of the wintering population available in the literature were used, obtained from aerial censuses (Rufino & Neves 2004) or coastal surveys (Catry et al. 2010a; Jesus 2018).
Similar to the indicator for the abundance of breeding populations, the relative abundance of non-breeding seabirds and waders was presented as the estimated number of birds annually in proportion to a reference value. The reference value was established based on the first 10 years of the time series, following the methodology described above (see previous point). The same procedure was used to define the assessment thresholds. It was possible to assess this indicator for a group of 30 different species (Table 7; Figure 5).
Modelling the distribution of non-breeding seabird abundance
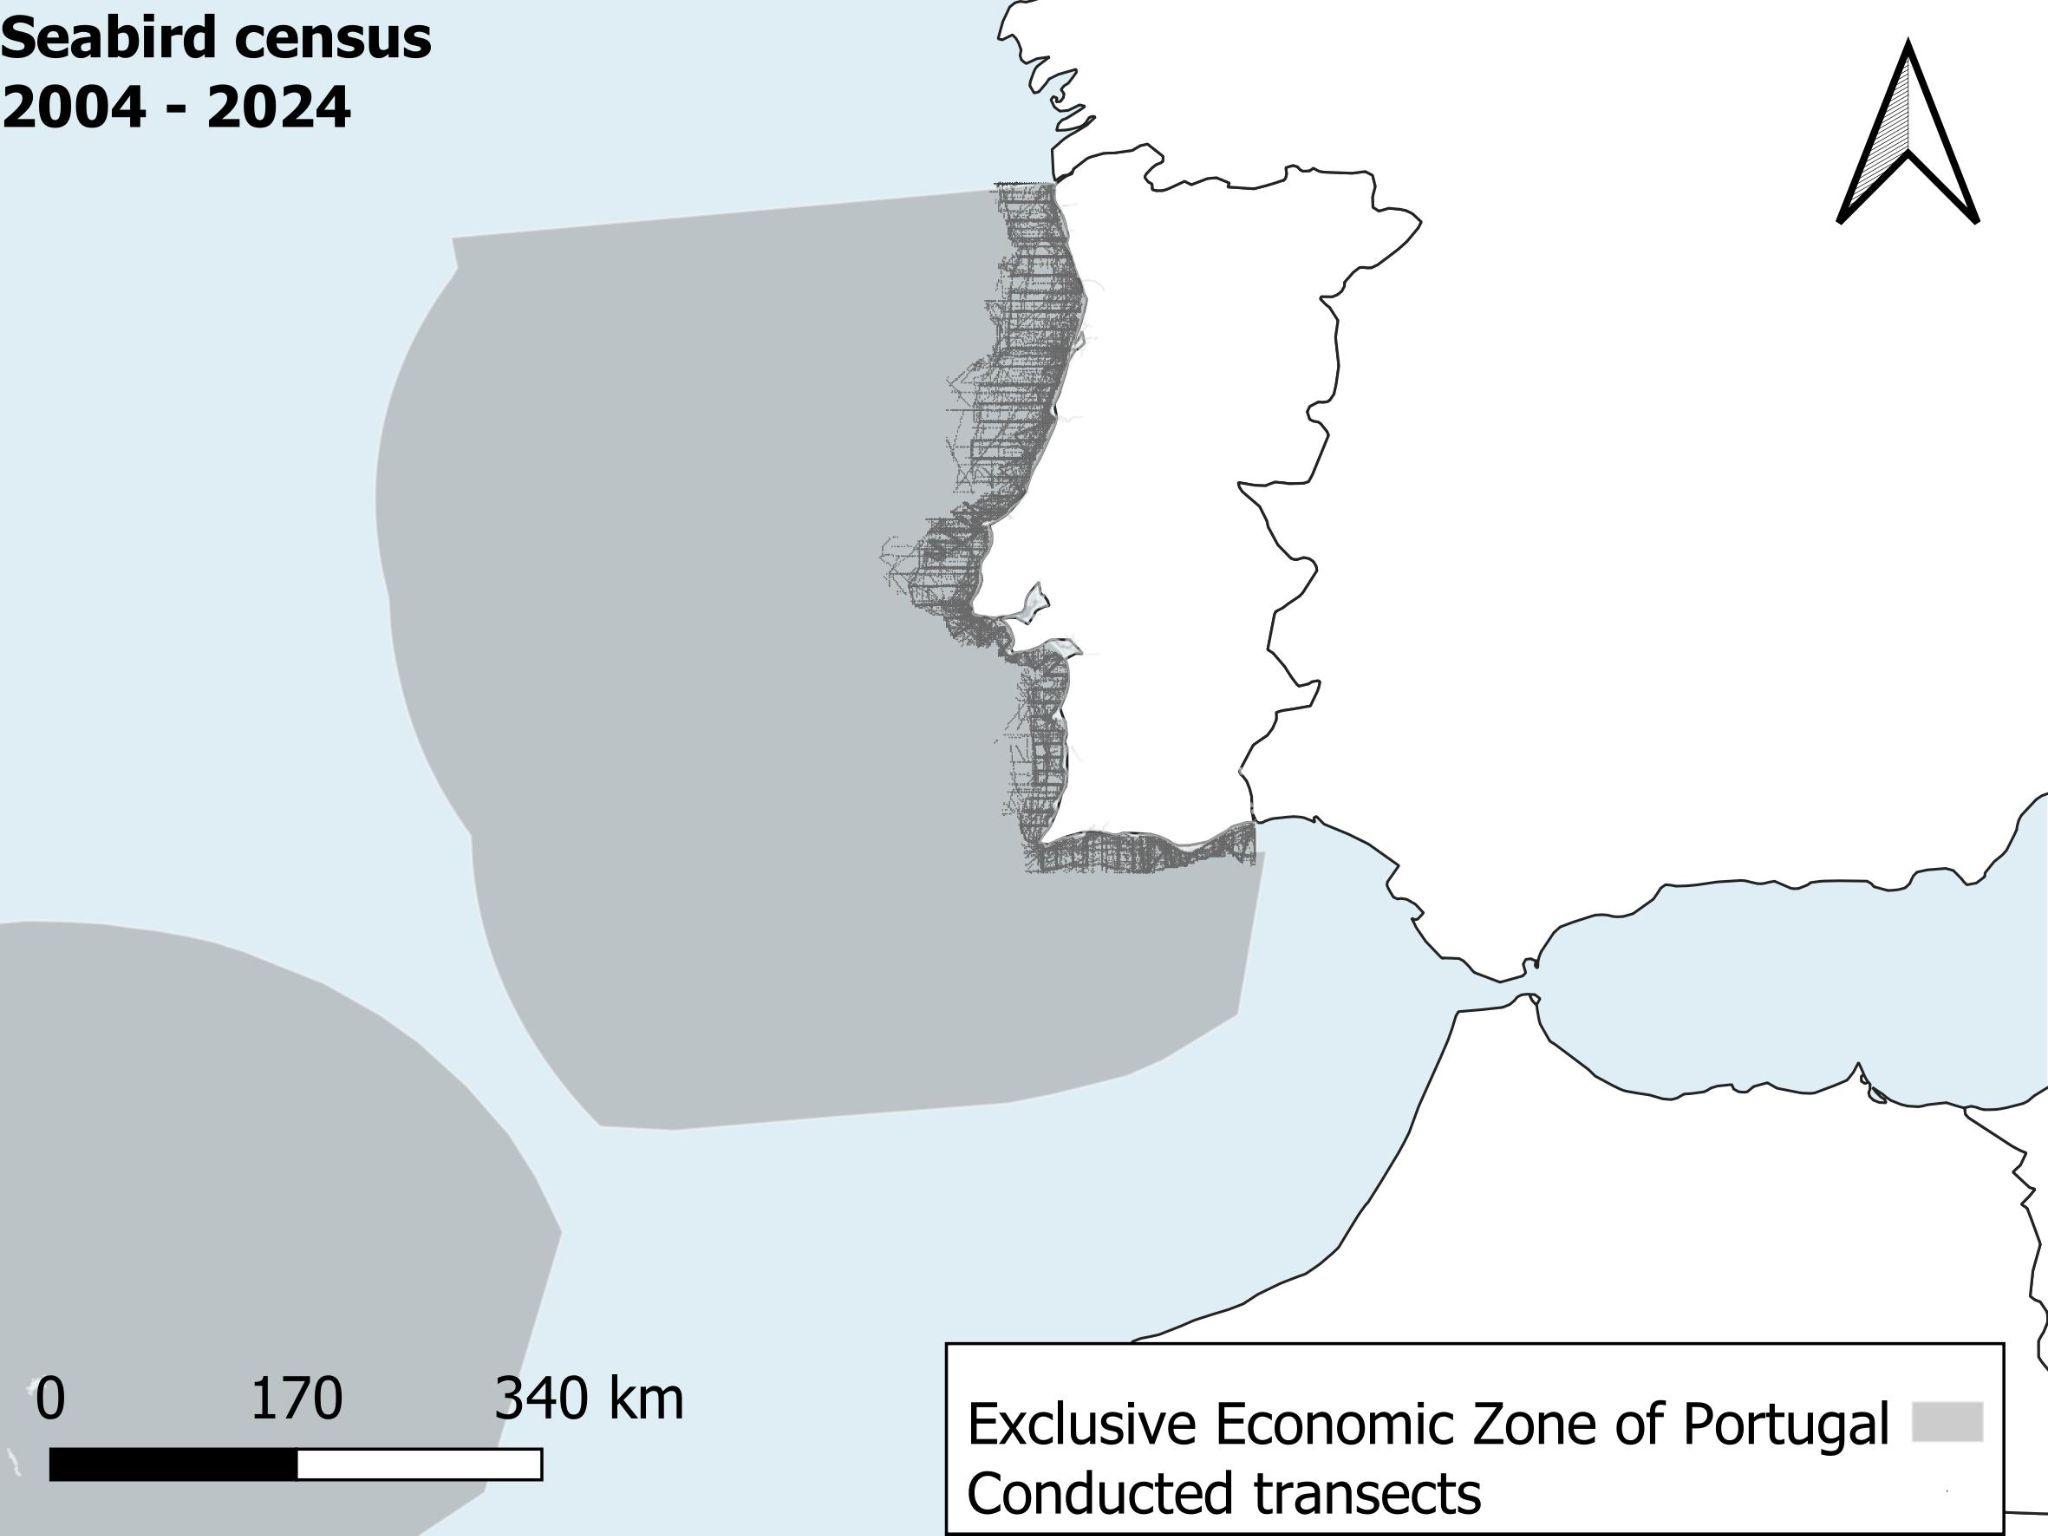
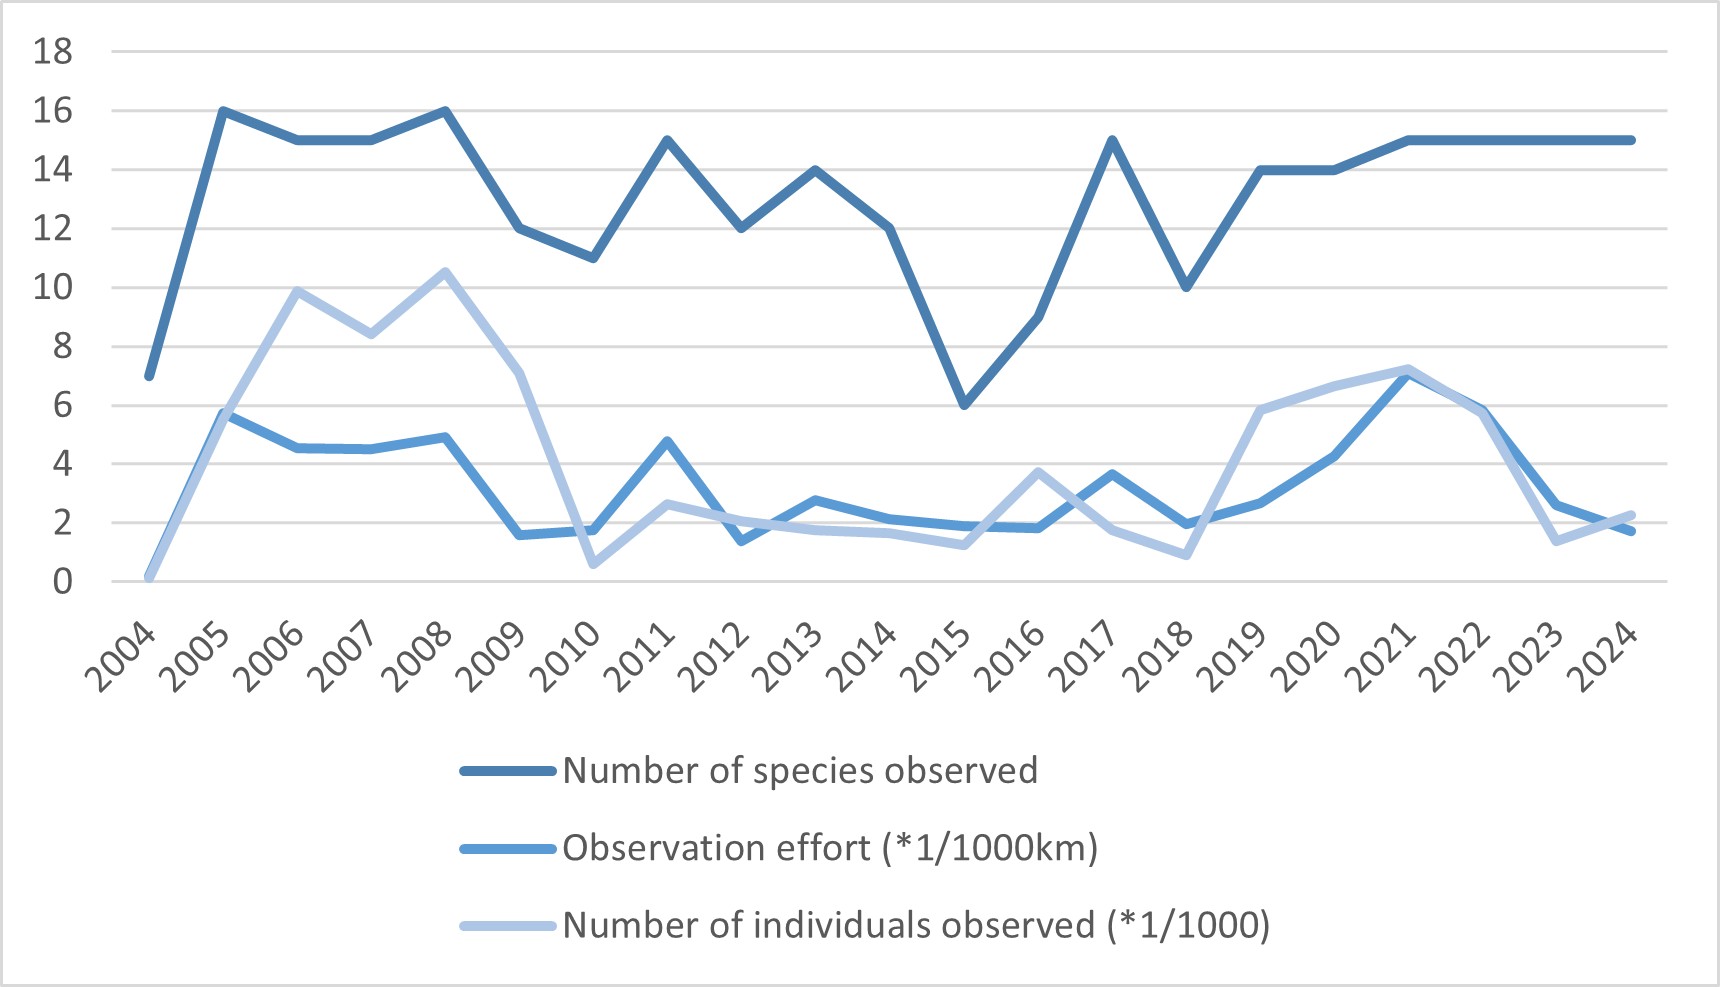
In this exercise, data from marine censuses conducted on board vessels were used. Data collection took place between December 2004 and December 2024, following the ESAS methodology (Camphuysen & Garthe 2004). The information was collected mainly in the coastal area of Mainland Portugal, up to a depth of 200 m (Figure 6). All birds on the water were counted along a 300 m wide transect. The snapshot method was used to count birds in flight. Only birds observed within the transect were considered in the following analyses. Along a total of 67,871 km of transects, 87,110 individuals of the 16 target species in this analysis were recorded (Figure 7).
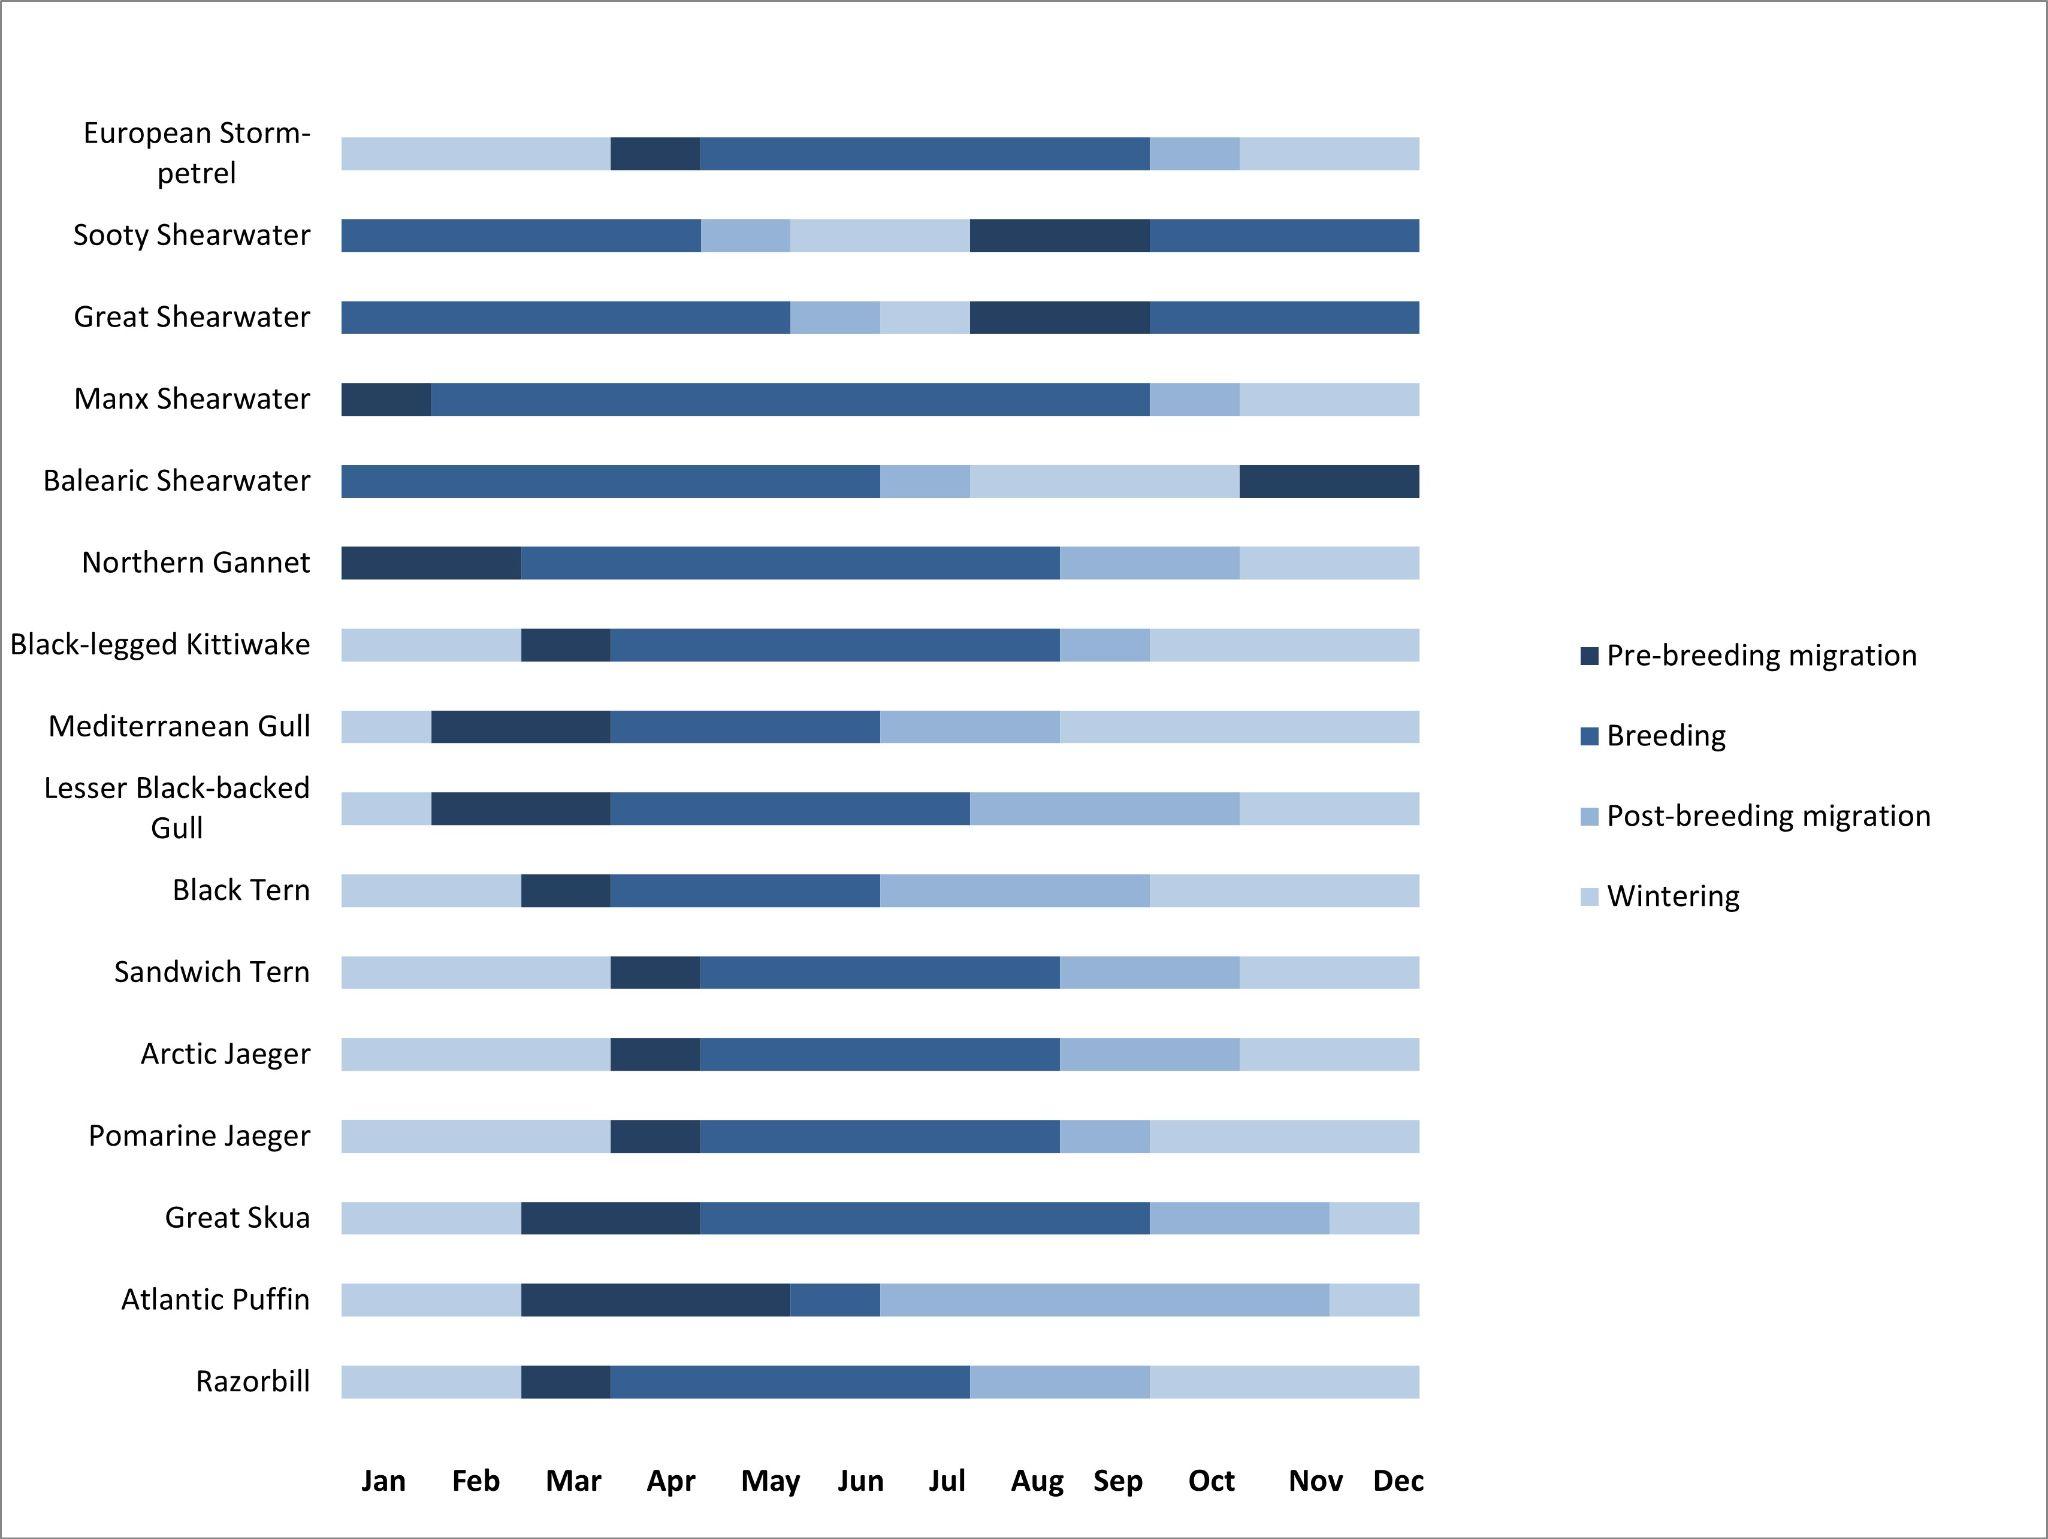
The total number of birds counted each month of each year was added up for each grid square in a 10x10 km grid. This grid was pre-designed based on marine census coverage, including the entire coastal strip of the Mainland region, up to a bathymetric depth of 200 m. To model bird abundance per grid square, spatial, environmental and temporal variables were used that have been shown to have an effect on the distribution and abundance of seabirds in previous studies (Pereira et al. 2018; Araújo et al. 2022a; De la Cruz et al. 2022a). The variables considered were longitude, latitude, year, phenological period, sea state, substrate type, distance from the coast, bathymetry, chlorophyll a, chlorophyll a in the previous month, sea surface temperature, sea surface temperature in the previous month, zooplankton, zooplankton in the previous month, sardine Sardina pilchardus biomass, horse mackerel Trachurus trachurus biomass, and anchovy Engraulis encrasicolus biomass (Table 8). The centre of the grid square was used to obtain the value of the spatially distributed variables. Latitude, longitude, year and sea state (on the Beaufort scale) were recorded at sea. The phenological period was defined for each species based on the information available in the literature, with the following categories: breeding, post-breeding migration, wintering and pre-breeding migration (Figure 8).
The type of seabed substrate was obtained from the European Marine Observation and Data Network (EMODnet) and characterised into five primary categories: mud/silty sand, sand, coarse-grained sediment, mixed sediments and rock/boulders. Bathymetry was also obtained from EMODnet. The distance to the coast was calculated from the georeferenced layer of the European coastline, made available by the European Environment Agency (EEA). Chlorophyll a, sea surface temperature and zooplankton were obtained from the European Union's Copernicus Marine Environment Service (Aznar et al. 2016; Jean-Michel et al. 2021), at monthly resolution and for a grid of 0.083 degrees (about 9 km). The values of these three variables were also obtained for the month prior to the observations, assuming that there is a time lag between these primary production variables and the response of the upper elements of the food chain, in this case seabirds (Suryan et al. 2012). The annual biomass values for sardine, horse mackerel and anchovy were obtained for the Iberian shelf (ICES 2024).
The models were adjusted using the number of birds recorded during the observation effort. A stepwise regression selection was implemented based on the explained deviation to select the final model. The restricted maximum likelihood method was used to estimate the smoothing parameters. To avoid overfitting, restrictions were implemented on the maximum degrees of freedom for the smoothing functions of all variables (k = 4). Two types of response variable distribution were also considered, negative binomial and Tweedie, in order to take into account the overdispersion of the data. The final predictive values were obtained using the final model selected, specific to each species, for the phenological period and sea state with the highest estimated coefficient values, reflecting the conditions with the highest abundances. The sum of these values for the entire study area resulted in the estimated number of birds, along with the respective 95% confidence intervals.
| Variable | Data source |
|---|---|
| Substrate type | EMODnet Geology |
| Distance to the coast | Coastlines, European Environment Agency |
| Bathymetry | EMODnet Bathymetry |
| Chlorophyll a | Copernicus (Aznar et al. 2016) |
| Chlorophyll a (previous month) | Copernicus (Aznar et al. 2016) |
| Sea surface temperature | Copernicus (Jean-Michel et al. 2021) |
| Sea surface temperature (previous month) | Copernicus (Jean-Michel et al. 2021) |
| Zooplankton | Copernicus (Aznar et al. 2016) |
| Zooplankton (previous month) | Copernicus (Aznar et al. 2016) |
| Sardine biomass | ICES |
| Horse mackerel biomass | ICES |
| Anchovy biomass | ICES |
Indicator B3 – Marine Bird Breeding Productivity
The assessment of the marine bird breeding productivity indicator followed the methodology described by Frederiksen et al. (2022), adopted by OSPAR (OSPAR Agreement 2016-10). In preparing this indicator, time series of annual productivity were used, calculated as the number of fledglings or near-fledglings produced by each pair or nest in a sample of breeding sites. Not all sites were sampled in all years of the time series. The method used was based on the assumption that the missing values had a random temporal distribution, and an annual estimate was calculated using the sample size-weighted average for colonies with available data to reduce the effect of missing data. For a region to be included in the analysis, there had to be at least 10 years of productivity sampling in two distinct colonies or breeding sites. If only one colony or site was sampled, that unit had to be representative of the situation in the region (e.g. cases where data come from the largest known colony in the area).
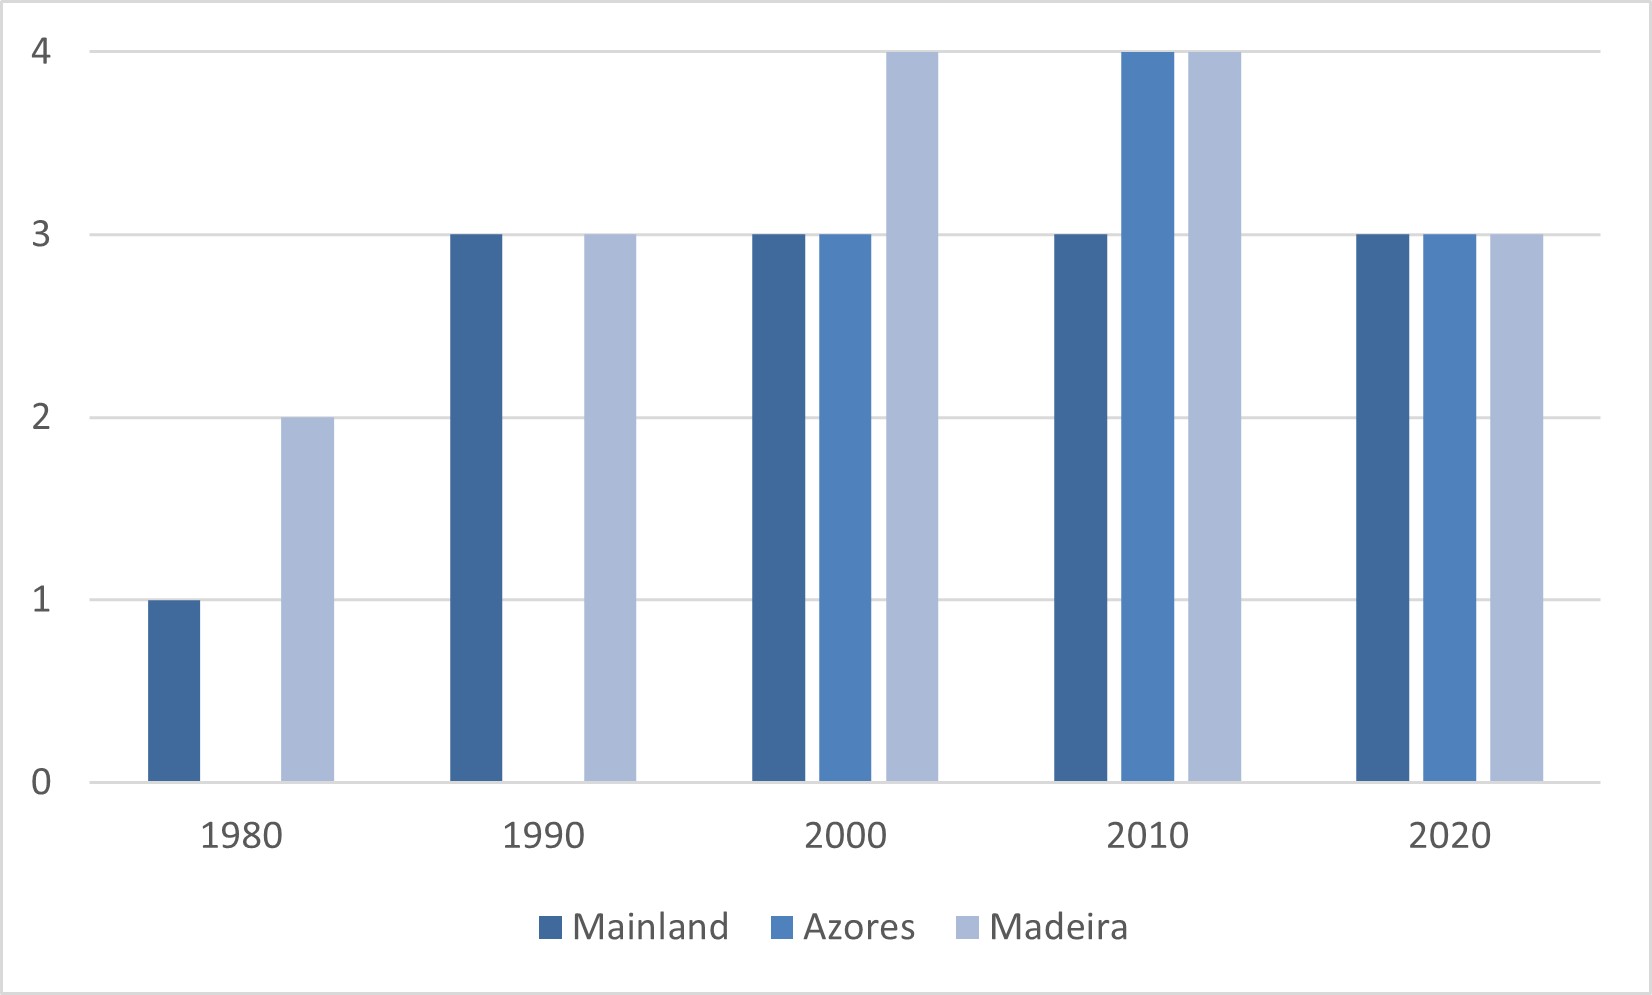
The metric used in this indicator was the estimated population growth rate, obtained by calculating the arithmetic mean of productivity in the region over the last six years. The six-year average was used to smooth out the population trend. The population trend was defined as the factor by which the population grows each year (the ratio between the population size in a given year and the population size in the previous year). A population with a stable trend has a ratio of 1, a growing population has a ratio greater than 1, and a declining population has a ratio less than 1.
Thresholds were defined for each species within each region to determine that the growth rate, if maintained, would result in a population decline greater than or equal to 30% over the next three generations. This concept is consistent with the IUCN Red List criteria for defining a species as ‘Vulnerable’ (IUCN 2012). The most recent value in the time series was used to assess the current environmental status of the population in each region. For more details on the methodology used to assess this indicator, see Frederiksen et al. (2022). It was possible to make this assessment for a group of seven different species (Table 6; Figure 9).
4. Conservation status
Continente - Almeida J, Godinho C, Leitão D & Lopes RJ (2022). Lista Vermelha das Aves de Portugal Continental. SPEA, ICNF, LabOR/UÉ, CIBIO/BIOPOLIS, Portugal.
Açores e Madeira - Cabral MJ (coord.), Almeida J, Almeida PR, Dellinger T, Ferrand de Almeida N, Oliveira ME, Palmeirim JM, Queiroz AI, L Rogado L & Santos-Reis M (eds.) (2005). Livro Vermelho dos Vertebrados de Portugal. Instituto da Conservação da Natureza, Lisboa.
UICN Global - BirdLife International (2025). IUCN Red List for birds. Disponível em https://datazone.birdlife.org e acedido a 30.11.2025.
Ward EJ, Holmes EE, Thorson JT & Collen B (2014). Complexity is costly: a meta‐analysis of parametric and non‐parametric methods for short‐term population forecasting. Oikos 123(6): 652-661. Bibliography:
Suryan R, Santora J & Sydeman W (2012). New approach for using remotely sensed chlorophyll a to identify seabird hotspots. Marine Ecology Progress Series 451: 213–225. Bibliography:
Rufino R & Neves R (2004). Wintering common scoter Melanitta nigra in Portugal: results of aerial surveys - 1991-1999. Regional Status Reports (unpublished report). Bibliography:
Pereira JM, Krüger L, Oliveira N, Meirinho A, Silva A, Ramos JA, Paiva VH (2018). Using a multi-model ensemble forecasting approach to identify key marine protected areas for seabirds in the Portuguese coast. Ocean Coastal Management 153: 98–107 Bibliography:
Mercker M, Markones N, Borkenhagen K, Schwemmer H, Wahl & J Garthe S (2021). An integrated framework to estimate seabird population numbers and trends. Journal of Wildlife Management 85: 751-771. Bibliography:
Meirinho A, Barros N, Oliveira N, Catry P, Lecoq M, Paiva V, Geraldes P, Granadeiro JP, Ramírez I & Andrade J (2014). Atlas das Aves Marinhas de Portugal. Sociedade Portuguesa para o Estudo das Aves. Bibliography:
Lecoq M, Lourenço PM, Catry P, Andrade J & Granadeiro JP (2013). Wintering waders on the Portuguese mainland non-estuarine coast: results of the 2009-2011 survey. Wader Study Group Bulletin 120: 66-70. Bibliography:
Kolzsch A, Lohr A, Partecke J, Quetting M, Safi K, Scharf A, Schneider G, Lang I, Schaeuffelhut F, Landwehr M, Storhas M, van Schalkwyk L, Vinciguerra C, Weinzierl R & Wikelski M (2022). The Movebank system for studying global animal movement and demography. Methods in Ecology and Evolution 13(2): 419-431. Bibliography:
Jesus AGC (2018). Contribuição para a monitorização da negrola (Melanitta nigra) nas ZPEs Ria de Aveiro e Aveiro-Nazaré. Tese de mestrado em Ecologia Aplicada. Universidade de Aveiro. 52pp. Bibliography:
Jean-Michel L, Eric G, Romain B-B, Gilles G, Angélique M, Marie D, Clément B, Mathieu H, Olivier LG, Charly R, Tony C, Charles-Emmanuel T, Florent G, Giovanni R, Mounir B, Yann D & Pierre-Yves LT (2021). The Copernicus Global 1/12° Oceanic and Sea Ice GLORYS12 Reanalysis. Frontiers in Earth Science 9: 698876. Bibliography:
IUCN (2012). IUCN Red List Categories and Criteria: Version 3.1. Second edition. Gland, Switzerland and Cambridge, UK. IUCN. 32pp. Bibliography:
ICES (2024). Working Group on Southern Horse Mackerel, Anchovy and Sardine (WGHANSA). ICES Scientific Reports 6(46): 761pp. Bibliography:
Frederiksen M, Dierschke V, Marra S, Parsons M, French G, Fusi M, Schekkerman H, Anker-Nilssen T & Mitchell I (2022). Marine Bird Breeding Productivity. In OSPAR (2023). The 2023 Quality Status Report for the North-East Atlantic. OSPAR Commission, London. Bibliography:
Equipa Atlas (2022). III Atlas das Aves Nidificantes de Portugal (2016-2021). SPEA, ICNF, LabOr/UÉ, IFCN. Portugal. Bibliography:
Dierschke V, Marra S, Parsons M, Fusi M & French G (2022b). Marine Bird Abundance. In OSPAR (2023). The 2023 Quality Status Report for the North-East Atlantic. OSPAR Commission, London. Bibliography:
Dierschke V, Markones N & Mercker M. (2022a). Pilot Assessment of Marine Bird Abundance – Non-Breeding Offshore Birds. In OSPAR (2023). The 2023 Quality Status Report for the North-East Atlantic. OSPAR Commission, London. Bibliography:
De la Cruz A, Ramos F, Tornero J, Rincón MM, Jiménez MP & Arroyo GM (2022a). Seabird distribution is better predicted by abundance of prey than oceanography. A case study in the Gulf of Cadiz (SW, Iberian Peninsula). ICES Journal of Marine Science 79: 204–217. Bibliography:
Camphuysen KCJ & Garthe S (2004). Recording foraging seabirds at sea standardised recording and coding of foraging behaviour and multi-species foraging associations. Atlantic Seabirds 6: 1–32. Bibliography:
Bennett S, Phillips RA & Green JA (2025). Quantifying the effect of time on geolocation accuracy in seabirds. Marine Ornithology 53(2): 331–335. Bibliography:
Aznar R, Sotillo MG, Cailleau S, Lorente P, Levier B, Amo-Baladrón A, Reffray G & Alvarez Fanjul E (2016). Strengths and weaknesses of the CMEMS forecasted and reanalyzed solutions for the Iberia-Biscay-Ireland (IBI) waters. Journal of Marine Systems 159: 1–14. Bibliography:
Araújo H, Correia-Rodrigues P, Bastos-Santos J, Ferreira M, Pereira AT, Martinez-Cedeira J, Vingada J & Eira C (2022a). Seabird abundance and distribution off western Iberian waters estimated through aerial surveys. Marine Ornithology 50: 71-80. Bibliography:
Catry P, Costa H, Elias G & Matias R (2010a). Aves de Portugal, Ornitologia do Território Continental. Assírio e Alvim, Lisboa Glossary:
The PTT (platform transmitter terminal) is a small device attached to birds to study their large-scale movements (generally migration and wintering, but also breeding). These devices use the Argos satellite system to obtain information on position, latitude, longitude and altitude, anywhere on Earth, via a network of satellites in orbit. They are as accurate as GPS devices. Glossary:
An indicator of phytoplankton biomass and primary productivity. Glossary:
An international convention for the protection of the marine environment of the North-East Atlantic, responsible for defining environmental indicators and targets. Glossary:
A reference value used to determine whether or not a population has reached a desired state. Glossary:
Negative impacts caused directly by human activities on the environment, affecting terrestrial and aquatic ecosystems and the atmosphere. These include pollution, changes in land use, resource extraction, atmospheric emissions and disturbance, resulting in biodiversity loss and ecosystem degradation. Glossary:
A species or parameter that reflects the state of an ecosystem or environmental changes. Glossary:
Standardised bird counts carried out at sea to estimate abundance and distribution. Glossary:
A set of data collected consistently over time, used to analyse trends. Glossary:
Monitoring the movements of individuals using tracking devices. Glossary:
The direction of change in the size of a population over time (increase, decline or stability). Glossary:
A measure of a population’s breeding success, generally expressed as the average number of chicks produced per pair. Glossary:
The total quantity of an animal or plant population present in a given ecosystem, usually expressed in units of weight. Glossary:
A concept defined under the Marine Strategy Framework Directive (MSFD), referring to the condition of the elements of the marine environment, including birds. It aims to assess whether ecosystems are healthy, balanced and capable of supporting ecological functions and human uses in a sustainable manner. The ultimate goal is for the components and ecosystems to achieve Good Environmental Status. Glossary:
A small device attached to birds to study their movements at a finer scale (usually during the breeding season). These devices use the Global Positioning System (GPS) to obtain information on position, latitude, longitude and altitude at any point on Earth, using a network of orbiting satellites. Glossary:
A group of birds associated with coastal or inland wetlands, generally found in habitats such as mudflats, saltmarshes, estuaries, lagoon margins, sandy areas and flooded zones. Some of these species also use the sandy and rocky coasts of Portugal. Glossary:
Under the United Nations Convention on the Law of the Sea, coastal states are entitled to declare an EEZ comprising maritime area beyond their territorial waters. The national EEZ is delimited by an imaginary line situated 200 nautical miles from the coast, separating national waters from international or shared waters. Within its EEZ, each state has rights such as the exploitation of marine resources, the conduct of scientific research and the regulation of fishing by foreign vessels. Glossary:
A period generally corresponding to the winter months, which may include part of autumn. Glossary:
A small device attached to birds to study their large-scale movements (usually migration), which works by recording light intensity (from which the duration of night and the local midday time are estimated, and consequently the latitude and longitude on each day). Glossary:
A small bony fish of the family Engraulidae, whose scientific name is Engraulis encrasicolus, also known as the European anchovy. Glossary:
An international non-governmental organisation (NGO) that promotes the conservation of birds, their habitats and global biodiversity, with representation in 120 countries through other local and national NGOs. SPEA is the representative in Portugal of BirdLife International.